
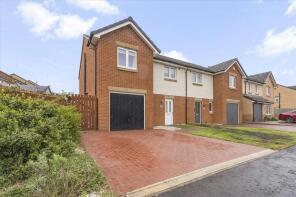
House Prices in Redding
House prices in Redding have an overall average of £220,671 over the last year.
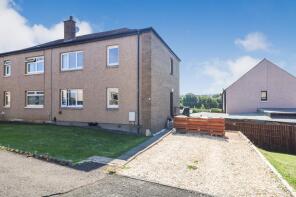
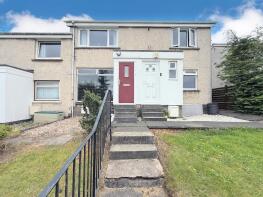
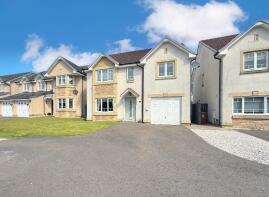
The majority of properties sold in Redding during the last year were detached properties, selling for an average price of £315,024. Semi-detached properties sold for an average of £205,003, with terraced properties fetching £164,076.
Overall, the historical sold prices in Redding over the last year were 3% down on the previous year and 2% down on the 2023 peak of £225,046.
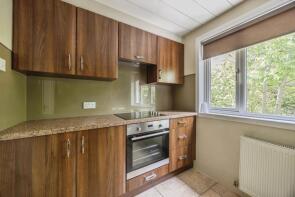
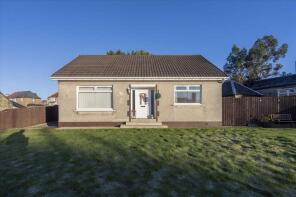
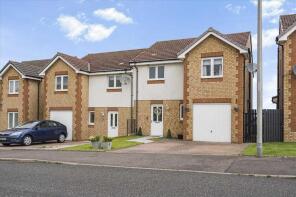
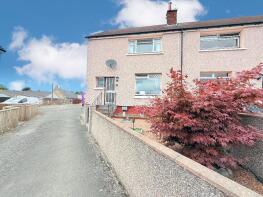
Properties Sold
51, Jarvie Road, Falkirk FK2 9FD
| Today | See what it's worth now |
| 23 Dec 2025 | £203,500 |
| 5 Mar 2013 | £115,000 |
15, Overton Crescent, Falkirk FK2 9XS
| Today | See what it's worth now |
| 22 Dec 2025 | £170,000 |
| 1 Apr 2005 | £50,000 |
No other historical records.
34, Hillock Avenue, Falkirk FK2 9UT
| Today | See what it's worth now |
| 17 Dec 2025 | £181,500 |
| 8 Sep 2017 | £92,000 |
The Hillock, Main Street, Redding FK2 9YF

| Today | See what it's worth now |
| 16 Dec 2025 | £400,000 |
No other historical records.
14, Forrester Street, Falkirk FK2 9FE
| Today | See what it's worth now |
| 9 Dec 2025 | £286,000 |
| 3 Oct 2017 | £190,500 |
52, Gairloch Crescent, Falkirk FK2 9XB
| Today | See what it's worth now |
| 8 Dec 2025 | £125,000 |
| 1 Sep 2023 | £93,000 |
12, Scobbie Place, Falkirk FK2 9AF
| Today | See what it's worth now |
| 3 Dec 2025 | £502,000 |
| 9 Nov 2020 | £421,250 |
40, Mcgarvie Drive, Falkirk FK2 9FR
| Today | See what it's worth now |
| 27 Nov 2025 | £320,000 |
| 7 Apr 2014 | £193,000 |
No other historical records.
14, Brown Crescent, Falkirk FK2 9FG
| Today | See what it's worth now |
| 24 Nov 2025 | £307,200 |
| 5 Jul 2011 | £206,950 |
No other historical records.
44, Dovecot Road, Falkirk FK2 9YT
| Today | See what it's worth now |
| 20 Nov 2025 | £142,610 |
| 14 Oct 2020 | £80,000 |
58, Donaldson Road, Falkirk FK2 9TF
| Today | See what it's worth now |
| 19 Nov 2025 | £526,000 |
| 16 Jun 2015 | £372,000 |
No other historical records.
1, Hillcroft Cottage, School Road, Falkirk FK2 9XU
| Today | See what it's worth now |
| 11 Nov 2025 | £240,000 |
| 14 Jan 2020 | £193,000 |
Sherwood, Willow Grange, Redding FK2 9US
| Today | See what it's worth now |
| 6 Nov 2025 | £291,000 |
No other historical records.
7, Poolewe Drive, Redding FK2 9XA
| Today | See what it's worth now |
| 3 Nov 2025 | £97,000 |
No other historical records.
Dunvegan, Redding Road, Redding FK2 9XH
| Today | See what it's worth now |
| 28 Oct 2025 | £258,000 |
No other historical records.
27, Mcgarvie Drive, Falkirk FK2 9FR
| Today | See what it's worth now |
| 27 Oct 2025 | £250,050 |
| 29 Sep 2021 | £211,000 |
11, Kirkwood Avenue, Falkirk FK2 9UF
| Today | See what it's worth now |
| 27 Oct 2025 | £167,200 |
| 25 May 2015 | £93,100 |
No other historical records.
28, Hillock Avenue, Redding FK2 9UT


| Today | See what it's worth now |
| 23 Oct 2025 | £140,000 |
No other historical records.
6, Kirkwood Avenue, Falkirk FK2 9UF
| Today | See what it's worth now |
| 3 Oct 2025 | £110,000 |
| 3 Apr 2003 | £12,690 |
No other historical records.
86, Gairloch Crescent, Falkirk FK2 9XD
| Today | See what it's worth now |
| 29 Sep 2025 | £110,000 |
| 29 Oct 2018 | £66,500 |
31 Jasann, Meadowbank Street, Falkirk FK2 9XE
| Today | See what it's worth now |
| 23 Sep 2025 | £240,000 |
| 3 Nov 2014 | £154,000 |
8, Jarvie Road, Falkirk FK2 9FD
| Today | See what it's worth now |
| 16 Sep 2025 | £325,500 |
| 28 Jun 2016 | £198,000 |
No other historical records.
13, Kilgannan Drive, Falkirk FK2 9GU
| Today | See what it's worth now |
| 16 Sep 2025 | £245,000 |
| 4 May 2015 | £163,000 |
No other historical records.
44, Thomson Drive, Falkirk FK2 9GN

| Today | See what it's worth now |
| 15 Sep 2025 | £458,000 |
| 25 Jul 2014 | £319,950 |
No other historical records.
67, Allison Crescent, Falkirk FK2 9FP
| Today | See what it's worth now |
| 10 Sep 2025 | £170,000 |
| 20 Jan 2017 | £117,995 |
No other historical records.
Source Acknowledgement: © Crown copyright. Scottish house price data is publicly available information produced by the Registers of Scotland. Material has been reproduced with the permission of the Keeper of the Registers of Scotland and contains data compiled by Registers of Scotland. For further information, please contact data@ros.gov.uk. Please note the dates shown here relate to the property's registered date not sold date.This material was last updated on 4 February 2026. It covers the period from 8 December 1987 to 31 December 2025 and contains property transactions which have been registered during that period.
Disclaimer: Rightmove.co.uk provides this Registers of Scotland data "as is". The burden for fitness of the data relies completely with the user and is provided for informational purposes only. No warranty, express or implied, is given relating to the accuracy of content of the Registers of Scotland data and Rightmove plc does not accept any liability for error or omission. If you have found an error with the data or need further information please contact data@ros.gov.uk
Permitted Use: The Registers of Scotland allows the reproduction of the data which it provides to Rightmove.co.uk free of charge in any format or medium only for research, private study or for internal circulation within an organisation. This is subject to it being reproduced accurately and not used in a misleading context. The material must be acknowledged as Crown Copyright. You are not allowed to use this information for commercial purposes, nor must you copy, distribute, sell or publish the data in any way. For any other use of this material, please apply to the Registers of Scotland for a licence. You can do this online at www.ros.gov.uk, by email at data@ros.gov.uk or by writing to Business Development, Registers of Scotland, Meadowbank House, 153 London Road, Edinburgh EH8 7AU.
Map data ©OpenStreetMap contributors.
Rightmove takes no liability for your use of, or reliance on, Rightmove's Instant Valuation due to the limitations of our tracking tool listed here. Use of this tool is taken entirely at your own risk. All rights reserved.