
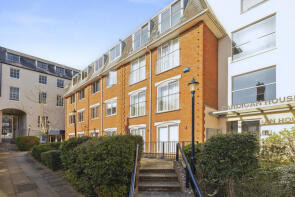
House Prices in SN8
House prices in SN8 have an overall average of £513,512 over the last year.
The majority of properties sold in SN8 during the last year were detached properties, selling for an average price of £717,383. Terraced properties sold for an average of £387,708, with semi-detached properties fetching £435,381.
Overall, the historical sold prices in SN8 over the last year were 3% down on the previous year and 11% down on the 2023 peak of £575,260.
Properties Sold
Milton House, Oxenwood SN8 3NQ
| Today | See what it's worth now |
| 10 Apr 2026 | £1,950,000 |
| 15 May 2008 | £2,149,784 |
108, Cadley Road, Marlborough SN8 3EA
| Today | See what it's worth now |
| 9 Apr 2026 | £485,000 |
| 6 Dec 2013 | £310,000 |
1b Withy Barn, The Green, Marlborough SN8 2BW
| Today | See what it's worth now |
| 31 Mar 2026 | £410,000 |
| 29 Sep 2006 | £380,000 |
Extensions and planning permission in SN8
See planning approval stats, extension build costs and value added estimates.

2, Hughes Close, Marlborough SN8 1TN
| Today | See what it's worth now |
| 27 Mar 2026 | £795,000 |
| 12 Jun 2017 | £660,000 |
Thyme Cottage, West Overton SN8 4ER

| Today | See what it's worth now |
| 25 Mar 2026 | £558,000 |
| 10 Dec 2019 | £485,000 |
34, Knowledge Crescent, Ramsbury SN8 2QZ
| Today | See what it's worth now |
| 20 Mar 2026 | £299,950 |
No other historical records.
17, Coster View, Marlborough SN8 3NS
| Today | See what it's worth now |
| 19 Mar 2026 | £265,000 |
| 27 Apr 2012 | £167,500 |
18, Spaines, Marlborough SN8 3LT
| Today | See what it's worth now |
| 17 Mar 2026 | £415,000 |
| 31 Jul 1997 | £92,500 |
No other historical records.
6, Wansdyke Road, Marlborough SN8 3PW

| Today | See what it's worth now |
| 17 Mar 2026 | £765,000 |
| 26 Nov 1998 | £245,000 |
No other historical records.
4, Manor Road, Marlborough SN8 3UF
| Today | See what it's worth now |
| 16 Mar 2026 | £517,500 |
| 1 Jun 2022 | £492,500 |
No other historical records.
Hazel Cottage, Lockeridge SN8 4EL
| Today | See what it's worth now |
| 13 Mar 2026 | £685,000 |
| 22 Jun 2020 | £495,000 |
Romans Halt, Church Lane, Marlborough SN8 2LX

| Today | See what it's worth now |
| 13 Mar 2026 | £975,000 |
| 14 Dec 2004 | £660,000 |
1, Forge Lane, Marlborough SN8 4ET
| Today | See what it's worth now |
| 11 Mar 2026 | £400,000 |
| 3 Feb 2006 | £185,000 |
No other historical records.
1, The Orchard, Wye Lane, Marlborough SN8 1PJ
| Today | See what it's worth now |
| 9 Mar 2026 | £595,000 |
| 14 Aug 2015 | £476,000 |
18, Wansdyke Road, Marlborough SN8 3PW
| Today | See what it's worth now |
| 5 Mar 2026 | £625,000 |
| 6 Dec 1996 | £139,950 |
No other historical records.
Stoniford House, Calf Lane, Stanton St. Bernard, Stanton St Bernard SN8 4LQ
| Today | See what it's worth now |
| 4 Mar 2026 | £815,000 |
No other historical records.
11, Kingsbury Terrace, Kingsbury Street, Marlborough SN8 1JG
| Today | See what it's worth now |
| 4 Mar 2026 | £350,000 |
| 14 Jan 2022 | £270,000 |
2, Walronds Close, Marlborough SN8 2TD
| Today | See what it's worth now |
| 27 Feb 2026 | £695,000 |
| 23 Feb 2007 | £380,000 |
3, Coombe Cottages, Marlborough Road, Marlborough SN8 3EX

| Today | See what it's worth now |
| 23 Feb 2026 | £340,000 |
| 12 Aug 2016 | £280,000 |
1, Hallam Cottages, Southend, Marlborough SN8 1SG
| Today | See what it's worth now |
| 20 Feb 2026 | £430,000 |
| 26 Jul 1999 | £230,000 |
3, Walronds Close, Marlborough SN8 2TD
| Today | See what it's worth now |
| 20 Feb 2026 | £700,000 |
| 11 Jul 1995 | £210,000 |
No other historical records.
3, Farmer Cottages, Little Bedwyn SN8 3JN
| Today | See what it's worth now |
| 17 Feb 2026 | £330,000 |
No other historical records.
14 Cardigan House, Ailesbury Court, High Street, Marlborough SN8 1AA
| Today | See what it's worth now |
| 16 Feb 2026 | £550,000 |
| 12 Dec 2018 | £500,000 |
No other historical records.
Source Acknowledgement: © Crown copyright. England and Wales house price data is publicly available information produced by the HM Land Registry.This material was last updated on 9 July 2026. It covers the period from 1 January 1995 to 30 April 2026 and contains property transactions which have been registered during that period. Contains HM Land Registry data © Crown copyright and database right 2026. This data is licensed under the Open Government Licence v3.0.
Disclaimer: Rightmove.co.uk provides this HM Land Registry data "as is". The burden for fitness of the data relies completely with the user and is provided for informational purposes only. No warranty, express or implied, is given relating to the accuracy of content of the HM Land Registry data and Rightmove does not accept any liability for error or omission. If you have found an error with the data or need further information please contact HM Land Registry.
Permitted Use: Viewers of this Information are granted permission to access this Crown copyright material and to download it onto electronic, magnetic, optical or similar storage media provided that such activities are for private research, study or in-house use only. Any other use of the material requires the formal written permission of Land Registry which can be requested from us, and is subject to an additional licence and associated charge.
Rightmove takes no liability for your use of, or reliance on, Rightmove's Instant Valuation due to the limitations of our tracking tool listed here. Use of this tool is taken entirely at your own risk. All rights reserved.