
House Prices in SO41 0PY
House prices in SO41 0PY have an overall average of £467,166 over the last year.
Overall, the historical sold prices in SO41 0PY over the last year were 50% down on the 2010 peak of £931,906.
Properties Sold
1, 7 Si Kaust Place, Hurst Road, Lymington SO41 0PY
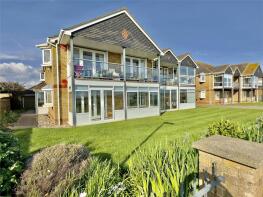
| Today | See what it's worth now |
| 13 Feb 2025 | £449,333 |
| 5 Sep 2018 | £450,000 |
2, 6 Henley Court, Hurst Road, Lymington SO41 0PY
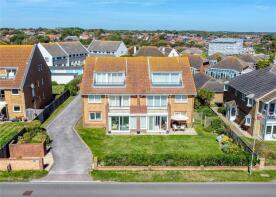
| Today | See what it's worth now |
| 6 Feb 2025 | £485,000 |
| 30 Jul 2015 | £400,000 |
Flat 2, Marine House, Hurst Road, Milford On Sea, Milford-on-sea SO41 0PY

| Today | See what it's worth now |
| 13 Oct 2023 | £700,000 |
No other historical records.
4, 8 Seaspray, Hurst Road, Lymington SO41 0PY
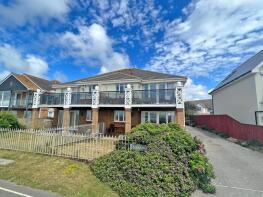
| Today | See what it's worth now |
| 30 Nov 2022 | £525,000 |
| 26 Oct 2006 | £310,250 |
1, Hurst Road, Lymington SO41 0PY
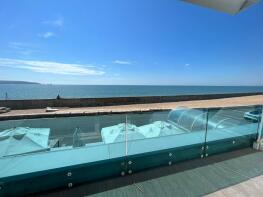
| Today | See what it's worth now |
| 20 Dec 2021 | £1,775,000 |
| 13 Jan 2012 | £962,500 |
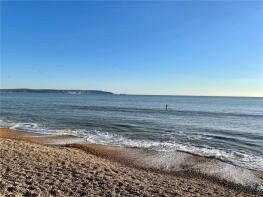
1, 6 Henley Court, Hurst Road, Lymington SO41 0PY
| Today | See what it's worth now |
| 10 Dec 2021 | £470,000 |
| 9 Sep 2003 | £250,000 |
Ground Floor Flat, 16, Hurst Road, Lymington SO41 0PY

| Today | See what it's worth now |
| 11 Nov 2021 | £550,000 |
| 9 Jan 2008 | £357,500 |
No other historical records.
Spindrift Flat 3, 14, Hurst Road, Milford-on-sea SO41 0PY

| Today | See what it's worth now |
| 28 Sep 2021 | £238,000 |
| 2 Mar 2018 | £203,000 |
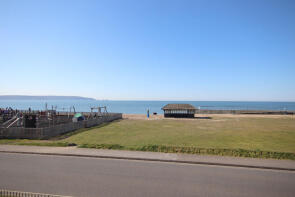
3, 8 Seaspray, Hurst Road, Lymington SO41 0PY
| Today | See what it's worth now |
| 24 Jun 2021 | £430,000 |
| 26 Jan 2001 | £245,000 |
No other historical records.
12, Hurst Road, Lymington SO41 0PY

| Today | See what it's worth now |
| 23 Jun 2021 | £1,725,000 |
| 12 May 2015 | £1,275,000 |
2, 8 Seaspray, Hurst Road, Lymington SO41 0PY

| Today | See what it's worth now |
| 14 May 2021 | £365,000 |
| 17 Apr 2003 | £242,000 |
9a, Hurst Road, Milford On Sea, Milford-on-sea SO41 0PY

| Today | See what it's worth now |
| 18 Mar 2021 | £795,000 |
No other historical records.
9, Hurst Road, Lymington SO41 0PY

| Today | See what it's worth now |
| 17 Mar 2021 | £795,000 |
No other historical records.
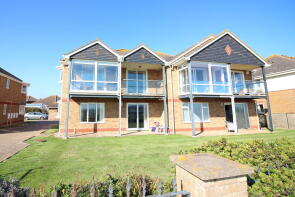
8, 7 Si Kaust Place, Hurst Road, Lymington SO41 0PY
| Today | See what it's worth now |
| 8 Mar 2019 | £456,000 |
| 11 Jul 2014 | £346,000 |
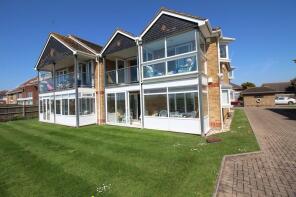
2, 7 Si Kaust Place, Hurst Road, Lymington SO41 0PY
| Today | See what it's worth now |
| 9 Nov 2018 | £460,000 |
| 12 Aug 1999 | £150,000 |
No other historical records.
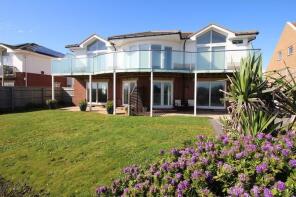
1 Dolphin Bank, 3, Hurst Road, Milford On Sea, Milford-on-sea SO41 0PY
| Today | See what it's worth now |
| 25 May 2018 | £398,000 |
| 7 Dec 2007 | £335,000 |
No other historical records.
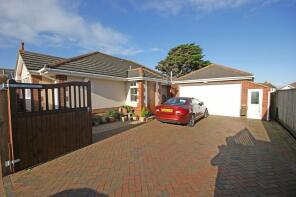
The Lodge, Hurst Point, Hurst Road, Milford-on-sea SO41 0PY
| Today | See what it's worth now |
| 11 Mar 2016 | £675,000 |
| 5 Dec 2003 | £407,500 |
No other historical records.
7, 7 Si Kaust Place, Hurst Road, Lymington SO41 0PY

| Today | See what it's worth now |
| 8 Oct 2014 | £365,000 |
| 27 Nov 1998 | £150,000 |
No other historical records.
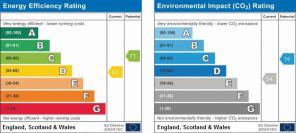
15a 1 The Bywaters, Hurst Road, Lymington SO41 0PY
| Today | See what it's worth now |
| 18 Jul 2013 | £600,000 |
| 23 Apr 1996 | £60,000 |
No other historical records.
6, 6 Henley Court, Hurst Road, Lymington SO41 0PY
| Today | See what it's worth now |
| 3 Aug 2012 | £240,000 |
| 23 Aug 1999 | £108,500 |
No other historical records.
17a Hatherwood House, Hurst Road, Lymington SO41 0PY

| Today | See what it's worth now |
| 26 Apr 2010 | £1,272,000 |
No other historical records.
1a, Hurst Road, Lymington SO41 0PY
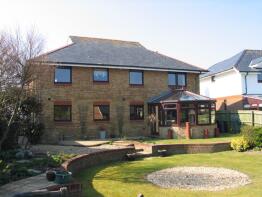
| Today | See what it's worth now |
| 3 Sep 2009 | £750,000 |
| 1 Mar 2002 | £465,000 |
6, 7 Si Kaust Place, Hurst Road, Lymington SO41 0PY
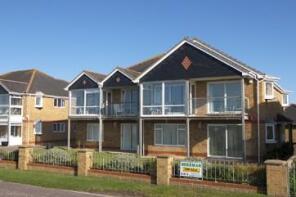
| Today | See what it's worth now |
| 22 Jan 2009 | £323,669 |
| 10 Jun 1999 | £147,000 |
No other historical records.
2 Dolphin Bank, 3, Hurst Road, Milford On Sea, Milford-on-sea SO41 0PY

| Today | See what it's worth now |
| 7 Sep 2007 | £331,500 |
No other historical records.
3 Dolphin Bank, 3, Hurst Road, Milford On Sea, Milford-on-sea SO41 0PY

| Today | See what it's worth now |
| 23 May 2007 | £450,000 |
No other historical records.
Find out how much your property is worth
The following agents can provide you with a free, no-obligation valuation. Simply select the ones you'd like to hear from.
Sponsored
All featured agents have paid a fee to promote their valuation expertise.

Hayward Fox
Lymington

FELLS GULLIVER LYMINGTON & NEW FOREST
Lymington

Pettengells Estate Agents
New Milton

Winkworth
Milford On Sea
Caldwells Estate Agents
Lymington
Get ready with a Mortgage in Principle
- Personalised result in just 20 minutes
- Find out how much you can borrow
- Get viewings faster with agents
- No impact on your credit score
What's your property worth?
House prices near SO41 0PY
Source Acknowledgement: © Crown copyright. England and Wales house price data is publicly available information produced by the HM Land Registry.This material was last updated on 2 December 2025. It covers the period from 1 January 1995 to 31 October 2025 and contains property transactions which have been registered during that period. Contains HM Land Registry data © Crown copyright and database right 2026. This data is licensed under the Open Government Licence v3.0.
Disclaimer: Rightmove.co.uk provides this HM Land Registry data "as is". The burden for fitness of the data relies completely with the user and is provided for informational purposes only. No warranty, express or implied, is given relating to the accuracy of content of the HM Land Registry data and Rightmove does not accept any liability for error or omission. If you have found an error with the data or need further information please contact HM Land Registry.
Permitted Use: Viewers of this Information are granted permission to access this Crown copyright material and to download it onto electronic, magnetic, optical or similar storage media provided that such activities are for private research, study or in-house use only. Any other use of the material requires the formal written permission of Land Registry which can be requested from us, and is subject to an additional licence and associated charge.
Data on planning applications, home extensions and build costs is provided by Resi.co.uk. Planning data is calculated using the last 2 years of residential applications within the selected planning authority. Home extension data, such as build costs and project timelines, are calculated using approximately 9,000 architectural projects Resi has completed, and 23,500 builders quotes submitted via Resi's platform. Build costs are adjusted according to inflation rates to more accurately represent today's prices.
Map data ©OpenStreetMap contributors.
Rightmove takes no liability for your use of, or reliance on, Rightmove's Instant Valuation due to the limitations of our tracking tool listed here. Use of this tool is taken entirely at your own risk. All rights reserved.

