
House Prices in Sheringham Station
House prices in Sheringham Station have an overall average of £281,042 over the last year.
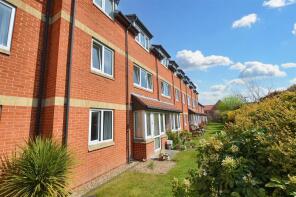
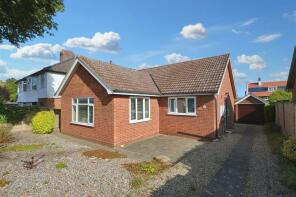
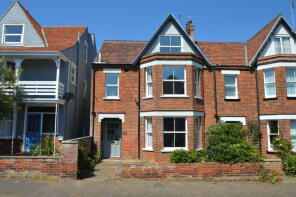
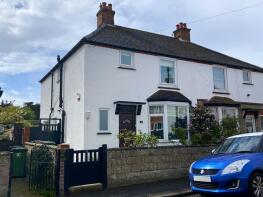
The majority of properties sold in Sheringham Station during the last year were flats, selling for an average price of £161,075. Terraced properties sold for an average of £334,062, with semi-detached properties fetching £344,396.
Overall, the historical sold prices in Sheringham Station over the last year were 21% down on the previous year and 11% down on the 2021 peak of £317,326.
Properties Sold
8, Links Road, Sheringham NR26 8LP
| Today | See what it's worth now |
| 18 Jun 2025 | £837,700 |
| 10 Dec 2013 | £385,000 |
No other historical records.
2, Repton Court, New Road, Sheringham NR26 8DL
| Today | See what it's worth now |
| 30 May 2025 | £250,000 |
| 21 Oct 2005 | £148,000 |
21a, Church Street, Sheringham NR26 8QR
| Today | See what it's worth now |
| 22 May 2025 | £200,000 |
No other historical records.
4, Shannock Court, George Street, Sheringham NR26 8DW


| Today | See what it's worth now |
| 16 May 2025 | £170,000 |
| 25 Oct 2013 | £138,000 |
Flat 3, 11, St Peters Road, Sheringham NR26 8QY
| Today | See what it's worth now |
| 28 Apr 2025 | £130,000 |
| 12 Jan 2024 | £125,000 |
13 Albury Cliff, The Driftway, Sheringham NR26 8LD

| Today | See what it's worth now |
| 31 Mar 2025 | £725,000 |
| 15 Sep 2006 | £475,000 |
No other historical records.
Flat 3, 6 The Croft, Cromer Road, Sheringham NR26 8RP
| Today | See what it's worth now |
| 28 Mar 2025 | £142,000 |
| 24 Jan 2014 | £87,500 |
7, Montague Road, Sheringham NR26 8LN
| Today | See what it's worth now |
| 27 Mar 2025 | £870,000 |
| 11 Dec 2020 | £725,423 |
4, St Nicholas Place, Sheringham NR26 8LE
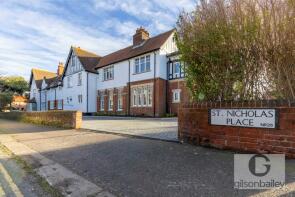
| Today | See what it's worth now |
| 24 Mar 2025 | £262,500 |
| 24 Feb 2017 | £164,000 |
Flat 1, 89, Station Road, Sheringham NR26 8RG
| Today | See what it's worth now |
| 14 Mar 2025 | £147,000 |
No other historical records.
12, Shannock Court, George Street, Sheringham NR26 8DW
| Today | See what it's worth now |
| 10 Mar 2025 | £155,000 |
| 1 Mar 2022 | £155,000 |
39, Holway Road, Sheringham NR26 8HW
| Today | See what it's worth now |
| 10 Mar 2025 | £337,000 |
| 1 Sep 2016 | £188,502 |
No other historical records.
6, Bedford Mews, Norfolk Road, Sheringham NR26 8HD
| Today | See what it's worth now |
| 5 Mar 2025 | £260,000 |
| 30 Mar 2010 | £165,000 |
4, Marriotts Way, Sheringham NR26 8RJ
| Today | See what it's worth now |
| 24 Feb 2025 | £162,000 |
| 12 Jul 2018 | £115,000 |
9, Samuels Court, Holt Road, Sheringham NR26 8UL
| Today | See what it's worth now |
| 10 Feb 2025 | £301,779 |
| 11 Oct 2006 | £155,000 |
4, Highwayman Court, Cromer Road, Sheringham NR26 8RP
| Today | See what it's worth now |
| 7 Feb 2025 | £135,000 |
| 28 Jul 2020 | £118,000 |
15, St Peters Road, Sheringham NR26 8QY

| Today | See what it's worth now |
| 24 Jan 2025 | £525,000 |
| 2 Dec 2020 | £231,000 |
No other historical records.
14, Shannock Court, George Street, Sheringham NR26 8DW
| Today | See what it's worth now |
| 20 Jan 2025 | £135,000 |
| 29 Jun 2023 | £135,000 |
3a, Erpingham House, St Peters Road, Sheringham NR26 8QY
| Today | See what it's worth now |
| 10 Jan 2025 | £84,000 |
| 31 Oct 2016 | £60,000 |
No other historical records.
9, The Driftway, Sheringham NR26 8LD

| Today | See what it's worth now |
| 6 Jan 2025 | £305,000 |
No other historical records.
20, Shannock Court, George Street, Sheringham NR26 8DW
| Today | See what it's worth now |
| 3 Jan 2025 | £120,000 |
| 3 Nov 2022 | £135,000 |
9, Morley Road, Sheringham NR26 8JD
| Today | See what it's worth now |
| 20 Dec 2024 | £345,000 |
No other historical records.
1, 13 15 Beaumaris Court, South Street, Sheringham NR26 8HB

| Today | See what it's worth now |
| 11 Dec 2024 | £200,000 |
| 28 Nov 2018 | £234,950 |
No other historical records.
5, Alexandra Road, Sheringham NR26 8HU
| Today | See what it's worth now |
| 5 Dec 2024 | £500,000 |
| 24 Nov 2017 | £275,000 |
No other historical records.
8, Barford Road, Sheringham NR26 8EQ
| Today | See what it's worth now |
| 27 Nov 2024 | £305,000 |
| 16 Oct 2017 | £245,000 |
Get ready with a Mortgage in Principle
- Personalised result in just 20 minutes
- Find out how much you can borrow
- Get viewings faster with agents
- No impact on your credit score
Source Acknowledgement: © Crown copyright. England and Wales house price data is publicly available information produced by the HM Land Registry.This material was last updated on 16 July 2025. It covers the period from 1 January 1995 to 30 May 2025 and contains property transactions which have been registered during that period. Contains HM Land Registry data © Crown copyright and database right 2025. This data is licensed under the Open Government Licence v3.0.
Disclaimer: Rightmove.co.uk provides this HM Land Registry data "as is". The burden for fitness of the data relies completely with the user and is provided for informational purposes only. No warranty, express or implied, is given relating to the accuracy of content of the HM Land Registry data and Rightmove does not accept any liability for error or omission. If you have found an error with the data or need further information please contact HM Land Registry.
Permitted Use: Viewers of this Information are granted permission to access this Crown copyright material and to download it onto electronic, magnetic, optical or similar storage media provided that such activities are for private research, study or in-house use only. Any other use of the material requires the formal written permission of Land Registry which can be requested from us, and is subject to an additional licence and associated charge.
Map data ©OpenStreetMap contributors.
Rightmove takes no liability for your use of, or reliance on, Rightmove's Instant Valuation due to the limitations of our tracking tool listed here. Use of this tool is taken entirely at your own risk. All rights reserved.