
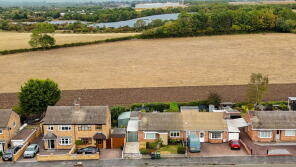
House Prices in Sileby
House prices in Sileby have an overall average of £254,238 over the last year.
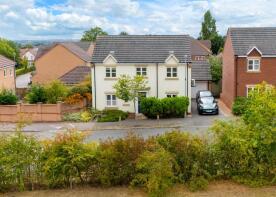
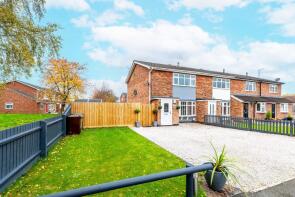
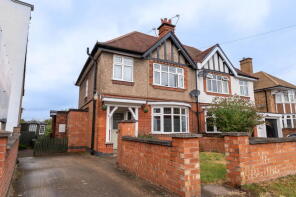
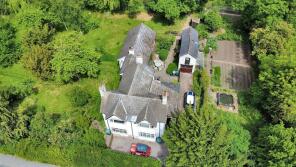
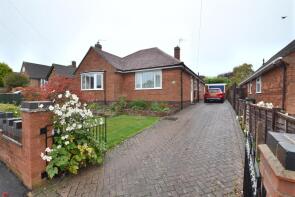
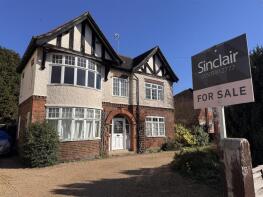
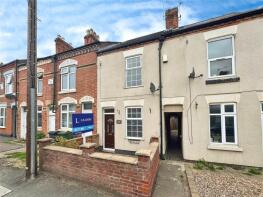
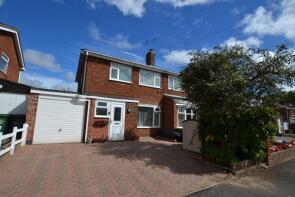
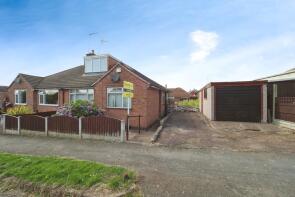
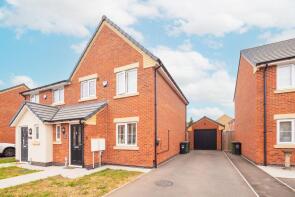
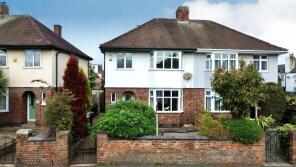
The majority of properties sold in Sileby during the last year were semi-detached properties, selling for an average price of £243,743. Terraced properties sold for an average of £188,602, with detached properties fetching £367,341.
Overall, the historical sold prices in Sileby over the last year were 3% down on the previous year and 8% down on the 2022 peak of £275,391.
Properties Sold
36, Swan Street, Loughborough LE12 7NW
| Today | See what it's worth now |
| 31 Mar 2026 | £150,000 |
| 16 Feb 2004 | £84,000 |
9, Burgess Close, Loughborough LE12 7YS
| Today | See what it's worth now |
| 30 Mar 2026 | £340,000 |
| 29 Oct 2021 | £295,000 |
No other historical records.
81, Charles Street, Loughborough LE12 7SH

| Today | See what it's worth now |
| 26 Mar 2026 | £202,500 |
| 20 May 2020 | £153,000 |
152, Barrow Road, Loughborough LE12 7LR
| Today | See what it's worth now |
| 20 Mar 2026 | £158,000 |
| 5 Aug 2021 | £140,000 |
No other historical records.
25, Wallace Drive, Loughborough LE12 7SQ
| Today | See what it's worth now |
| 13 Mar 2026 | £227,000 |
| 9 Aug 2013 | £116,500 |
2, Sunnylands Drive, Loughborough LE12 7WJ
| Today | See what it's worth now |
| 6 Mar 2026 | £445,000 |
| 16 May 2014 | £269,950 |
No other historical records.
6, Newbold Close, Loughborough LE12 7PB
| Today | See what it's worth now |
| 5 Mar 2026 | £240,000 |
| 28 Apr 2006 | £113,500 |
36, Cossington Road, Sileby LE12 7RS
| Today | See what it's worth now |
| 2 Mar 2026 | £275,000 |
No other historical records.
229, Ratcliffe Road, Sileby LE12 7PY
| Today | See what it's worth now |
| 27 Feb 2026 | £540,000 |
No other historical records.
153, Homefield Road, Sileby LE12 7TG
| Today | See what it's worth now |
| 23 Feb 2026 | £225,000 |
No other historical records.
12, Park Road, Sileby LE12 7TJ
| Today | See what it's worth now |
| 20 Feb 2026 | £315,000 |
No other historical records.
137, Cossington Road, Sileby LE12 7RP
| Today | See what it's worth now |
| 16 Feb 2026 | £455,000 |
No other historical records.
51, Swan Street, Loughborough LE12 7NN
| Today | See what it's worth now |
| 13 Feb 2026 | £169,950 |
| 25 Apr 2007 | £116,000 |
No other historical records.
19, Kilbourne Close, Loughborough LE12 7SD
| Today | See what it's worth now |
| 13 Feb 2026 | £245,000 |
| 3 Jun 2019 | £173,500 |
15, Chalfont Drive, Sileby LE12 7RQ
| Today | See what it's worth now |
| 12 Feb 2026 | £170,000 |
No other historical records.
9, Gray Lane, Loughborough LE12 7GS

| Today | See what it's worth now |
| 12 Feb 2026 | £290,000 |
| 20 Sep 2012 | £142,000 |
14, Healy Close, Loughborough LE12 7TU
| Today | See what it's worth now |
| 9 Feb 2026 | £293,000 |
| 16 May 2022 | £260,000 |
No other historical records.
27, The Banks, Loughborough LE12 7RD
| Today | See what it's worth now |
| 3 Feb 2026 | £192,000 |
| 27 Jun 2014 | £134,500 |
Flat 3, 1 7, Highbridge, Loughborough LE12 7LG

| Today | See what it's worth now |
| 2 Feb 2026 | £70,000 |
| 21 Jan 2000 | £28,500 |
47, Excelsior Way, Loughborough LE12 7XE
| Today | See what it's worth now |
| 30 Jan 2026 | £360,000 |
| 2 Dec 2022 | £375,995 |
No other historical records.
139, Ratcliffe Road, Loughborough LE12 7PX
| Today | See what it's worth now |
| 30 Jan 2026 | £270,000 |
| 27 Jan 2023 | £265,000 |
159, Homefield Road, Loughborough LE12 7TG
| Today | See what it's worth now |
| 29 Jan 2026 | £260,000 |
| 2 Oct 2012 | £130,000 |
15, Chaplin Close, Loughborough LE12 7SZ
| Today | See what it's worth now |
| 28 Jan 2026 | £198,100 |
| 12 Jun 2019 | £157,000 |
Source Acknowledgement: © Crown copyright. England and Wales house price data is publicly available information produced by the HM Land Registry.This material was last updated on 9 July 2026. It covers the period from 1 January 1995 to 30 April 2026 and contains property transactions which have been registered during that period. Contains HM Land Registry data © Crown copyright and database right 2026. This data is licensed under the Open Government Licence v3.0.
Disclaimer: Rightmove.co.uk provides this HM Land Registry data "as is". The burden for fitness of the data relies completely with the user and is provided for informational purposes only. No warranty, express or implied, is given relating to the accuracy of content of the HM Land Registry data and Rightmove does not accept any liability for error or omission. If you have found an error with the data or need further information please contact HM Land Registry.
Permitted Use: Viewers of this Information are granted permission to access this Crown copyright material and to download it onto electronic, magnetic, optical or similar storage media provided that such activities are for private research, study or in-house use only. Any other use of the material requires the formal written permission of Land Registry which can be requested from us, and is subject to an additional licence and associated charge.
Rightmove takes no liability for your use of, or reliance on, Rightmove's Instant Valuation due to the limitations of our tracking tool listed here. Use of this tool is taken entirely at your own risk. All rights reserved.