
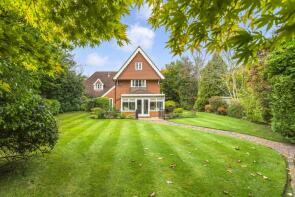
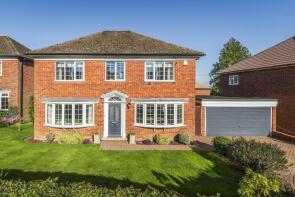
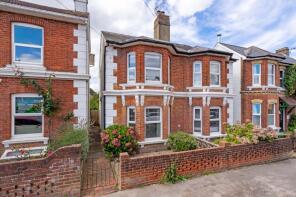
House Prices in Southborough
House prices in Southborough have an overall average of £584,023 over the last year.
The majority of properties sold in Southborough during the last year were semi-detached properties, selling for an average price of £545,969. Detached properties sold for an average of £862,760, with terraced properties fetching £392,515.
Overall, the historical sold prices in Southborough over the last year were 11% up on the previous year and 3% down on the 2022 peak of £599,810.
Properties Sold
80, Edward Street, Southborough, Tunbridge Wells TN4 0EB
| Today | See what it's worth now |
| 13 Apr 2026 | £425,000 |
| 9 Sep 2021 | £382,000 |
116a, London Road, Southborough, Tunbridge Wells TN4 0PN
| Today | See what it's worth now |
| 8 Apr 2026 | £230,000 |
| 27 Jul 2022 | £222,000 |
11, Crundwell Road, Southborough, Tunbridge Wells TN4 0LL
| Today | See what it's worth now |
| 30 Mar 2026 | £365,000 |
| 31 Jul 1997 | £79,000 |
55, Chestnut Avenue, Southborough, Tunbridge Wells TN4 0BT
| Today | See what it's worth now |
| 27 Mar 2026 | £488,000 |
No other historical records.
75, Prospect Road, Southborough, Tunbridge Wells TN4 0EE

| Today | See what it's worth now |
| 27 Mar 2026 | £825,000 |
| 4 Sep 2015 | £460,000 |
No other historical records.
15, Ruscombe Close, Southborough, Tunbridge Wells TN4 0SG

| Today | See what it's worth now |
| 25 Mar 2026 | £485,000 |
| 20 Dec 2012 | £242,000 |
208, St Johns Road, Tunbridge Wells TN4 9XD
| Today | See what it's worth now |
| 6 Mar 2026 | £780,000 |
| 4 Feb 2011 | £445,000 |
No other historical records.
18a, Fernhurst Crescent, Southborough, Tunbridge Wells TN4 0TD
| Today | See what it's worth now |
| 2 Mar 2026 | £485,000 |
No other historical records.
1, Rocks Hollow Gardens, Southborough, Tunbridge Wells TN4 0FE
| Today | See what it's worth now |
| 25 Feb 2026 | £725,000 |
| 19 Dec 2019 | £620,000 |
No other historical records.
10, Castle Street, Southborough, Tunbridge Wells TN4 0PE
| Today | See what it's worth now |
| 19 Feb 2026 | £329,000 |
| 4 Oct 2010 | £165,000 |
No other historical records.
49, Wilman Road, Tunbridge Wells TN4 9AL
| Today | See what it's worth now |
| 17 Feb 2026 | £900,000 |
| 18 Jun 2001 | £233,500 |
No other historical records.
Flat 4, 110, London Road, Southborough, Tunbridge Wells TN4 0PN
| Today | See what it's worth now |
| 13 Feb 2026 | £225,000 |
| 22 Dec 2014 | £205,000 |
No other historical records.
6, Charles Court, Charles Street, Southborough, Tunbridge Wells TN4 0DS
| Today | See what it's worth now |
| 26 Jan 2026 | £370,000 |
| 25 Aug 2017 | £315,000 |
Apartment 3, Radford House, Salomons Grove, Southborough, Tunbridge Wells TN4 0FJ
| Today | See what it's worth now |
| 23 Jan 2026 | £158,750 |
No other historical records.
4, Bedford Road, Southborough, Tunbridge Wells TN4 0HJ
| Today | See what it's worth now |
| 23 Jan 2026 | £465,000 |
| 29 Jun 2020 | £380,000 |
7, Dower House Crescent, Southborough, Tunbridge Wells TN4 0TT
| Today | See what it's worth now |
| 20 Jan 2026 | £1,275,000 |
No other historical records.
23, Pennington Road, Southborough, Tunbridge Wells TN4 0SS
| Today | See what it's worth now |
| 20 Jan 2026 | £865,000 |
| 12 Jun 2020 | £630,000 |
No other historical records.
52, Edward Street, Southborough, Tunbridge Wells TN4 0HB
| Today | See what it's worth now |
| 16 Jan 2026 | £375,000 |
| 28 Sep 2007 | £244,275 |
Flat 23, Southborough Gate, Pinewood Gardens, Southborough, Tunbridge Wells TN4 0FN

| Today | See what it's worth now |
| 16 Jan 2026 | £385,000 |
| 31 May 2019 | £445,000 |
No other historical records.
30, The Ridgewaye, Southborough, Tunbridge Wells TN4 0AD
| Today | See what it's worth now |
| 19 Dec 2025 | £730,000 |
| 19 Jul 1999 | £170,000 |
23, Brian Crescent, Southborough, Tunbridge Wells TN4 0AP
| Today | See what it's worth now |
| 19 Dec 2025 | £900,000 |
| 30 Nov 2018 | £480,000 |
No other historical records.
7, Bright Ridge, Southborough, Tunbridge Wells TN4 0JN
| Today | See what it's worth now |
| 18 Dec 2025 | £389,317 |
| 21 May 2010 | £172,000 |
39, Edward Street, Southborough, Tunbridge Wells TN4 0HB

| Today | See what it's worth now |
| 17 Dec 2025 | £370,000 |
No other historical records.
Source Acknowledgement: © Crown copyright. England and Wales house price data is publicly available information produced by the HM Land Registry.This material was last updated on 9 July 2026. It covers the period from 1 January 1995 to 30 April 2026 and contains property transactions which have been registered during that period. Contains HM Land Registry data © Crown copyright and database right 2026. This data is licensed under the Open Government Licence v3.0.
Disclaimer: Rightmove.co.uk provides this HM Land Registry data "as is". The burden for fitness of the data relies completely with the user and is provided for informational purposes only. No warranty, express or implied, is given relating to the accuracy of content of the HM Land Registry data and Rightmove does not accept any liability for error or omission. If you have found an error with the data or need further information please contact HM Land Registry.
Permitted Use: Viewers of this Information are granted permission to access this Crown copyright material and to download it onto electronic, magnetic, optical or similar storage media provided that such activities are for private research, study or in-house use only. Any other use of the material requires the formal written permission of Land Registry which can be requested from us, and is subject to an additional licence and associated charge.
Rightmove takes no liability for your use of, or reliance on, Rightmove's Instant Valuation due to the limitations of our tracking tool listed here. Use of this tool is taken entirely at your own risk. All rights reserved.