
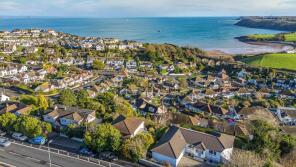
House Prices in TQ4
House prices in TQ4 have an overall average of £292,652 over the last year.
The majority of properties sold in TQ4 during the last year were detached properties, selling for an average price of £430,273. Semi-detached properties sold for an average of £283,832, with terraced properties fetching £231,613.
Overall, the historical sold prices in TQ4 over the last year were 4% down on the previous year and similar to the 2022 peak of £291,359.
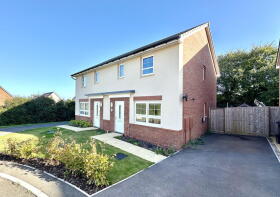
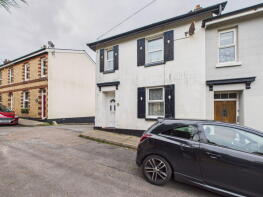
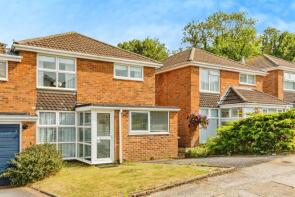
Properties Sold
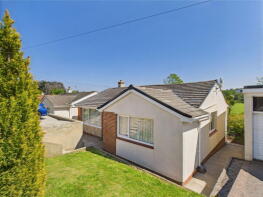
217, Roselands Drive, Paignton TQ4 7RN
| Today | See what it's worth now |
| 28 Apr 2026 | £350,000 |
| 31 Mar 2021 | £320,000 |
No other historical records.
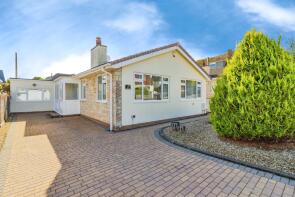
32, Lower Fowden, Paignton TQ4 6HR
| Today | See what it's worth now |
| 28 Apr 2026 | £450,000 |
| 13 Dec 2011 | £297,000 |
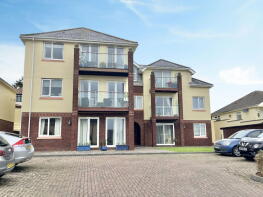
42, 47 Cypress Court, Fisher Street, Paignton TQ4 5DU

| Today | See what it's worth now |
| 17 Apr 2026 | £95,000 |
| 7 Aug 2019 | £119,000 |
Extensions and planning permission in TQ4
See planning approval stats, extension build costs and value added estimates.

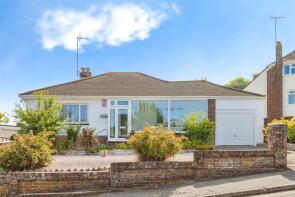
2, Harbourne Avenue, Paignton TQ4 7DU

| Today | See what it's worth now |
| 14 Apr 2026 | £267,500 |
| 15 Dec 2021 | £270,000 |
8, Meadowsweet Lane, Goodrington With Roselands, Paignton TQ4 7FL
| Today | See what it's worth now |
| 10 Apr 2026 | £220,000 |
| 9 Aug 2024 | £211,000 |
16, Homebourne House, Belle Vue Road, Paignton TQ4 6PT
| Today | See what it's worth now |
| 10 Apr 2026 | £55,000 |
| 13 Sep 2018 | £73,500 |
7, Lancaster House, Belle Vue Road, Paignton TQ4 6HD
| Today | See what it's worth now |
| 10 Apr 2026 | £116,000 |
| 11 Jun 2014 | £106,000 |
No other historical records.
50, Bridle Close, Paignton TQ4 7ST
| Today | See what it's worth now |
| 9 Apr 2026 | £285,000 |
| 14 Oct 2014 | £229,950 |
22, Homebourne House, Belle Vue Road, Paignton TQ4 6PT

| Today | See what it's worth now |
| 8 Apr 2026 | £64,000 |
| 31 Jul 2000 | £48,000 |
No other historical records.
21, Bidwell Brook Drive, Paignton TQ4 7NF
| Today | See what it's worth now |
| 8 Apr 2026 | £322,500 |
| 12 Dec 2001 | £129,950 |
24, Great Tree View, Paignton TQ4 7HT

| Today | See what it's worth now |
| 7 Apr 2026 | £275,000 |
| 30 Jun 2016 | £220,950 |
No other historical records.
77, Sturcombe Avenue, Paignton TQ4 7TD

| Today | See what it's worth now |
| 2 Apr 2026 | £150,000 |
| 5 Aug 2019 | £118,000 |
8, Holwill Tor Walk, Paignton TQ4 7EG
| Today | See what it's worth now |
| 2 Apr 2026 | £242,000 |
No other historical records.
59, Brantwood Drive, Paignton TQ4 5HY
| Today | See what it's worth now |
| 1 Apr 2026 | £360,000 |
| 9 Aug 1996 | £72,900 |
4, Hookhills Drive, Paignton TQ4 7LJ
| Today | See what it's worth now |
| 31 Mar 2026 | £390,000 |
| 25 Sep 2014 | £247,500 |
7, Gibson Road, Paignton TQ4 7AG

| Today | See what it's worth now |
| 30 Mar 2026 | £255,000 |
| 28 Feb 2002 | £88,500 |
No other historical records.
6, Seaways, Cliff Park Road, Paignton TQ4 6NB
| Today | See what it's worth now |
| 30 Mar 2026 | £222,500 |
| 3 Aug 2022 | £232,500 |
No other historical records.
33, Homebourne House, Belle Vue Road, Paignton TQ4 6PT

| Today | See what it's worth now |
| 27 Mar 2026 | £56,000 |
| 3 Jul 2007 | £105,000 |
2, Ashburn Walk, Paignton TQ4 7LX
| Today | See what it's worth now |
| 27 Mar 2026 | £277,500 |
| 18 Dec 2019 | £240,000 |
1, Broadsands Avenue, Paignton TQ4 6JJ
| Today | See what it's worth now |
| 27 Mar 2026 | £340,000 |
| 15 Jun 2001 | £115,000 |
No other historical records.
3, Cranberry Grove, Paignton TQ4 7UN
| Today | See what it's worth now |
| 27 Mar 2026 | £275,000 |
| 24 Oct 2022 | £314,995 |
No other historical records.
211, Dartmouth Road, Paignton TQ4 6LG
| Today | See what it's worth now |
| 27 Mar 2026 | £710,000 |
| 8 May 2003 | £130,500 |
17, Hill Park Terrace, Paignton TQ4 6EX
| Today | See what it's worth now |
| 23 Mar 2026 | £192,000 |
| 6 Jan 2006 | £145,000 |
Source Acknowledgement: © Crown copyright. England and Wales house price data is publicly available information produced by the HM Land Registry.This material was last updated on 9 July 2026. It covers the period from 1 January 1995 to 30 April 2026 and contains property transactions which have been registered during that period. Contains HM Land Registry data © Crown copyright and database right 2026. This data is licensed under the Open Government Licence v3.0.
Disclaimer: Rightmove.co.uk provides this HM Land Registry data "as is". The burden for fitness of the data relies completely with the user and is provided for informational purposes only. No warranty, express or implied, is given relating to the accuracy of content of the HM Land Registry data and Rightmove does not accept any liability for error or omission. If you have found an error with the data or need further information please contact HM Land Registry.
Permitted Use: Viewers of this Information are granted permission to access this Crown copyright material and to download it onto electronic, magnetic, optical or similar storage media provided that such activities are for private research, study or in-house use only. Any other use of the material requires the formal written permission of Land Registry which can be requested from us, and is subject to an additional licence and associated charge.
Rightmove takes no liability for your use of, or reliance on, Rightmove's Instant Valuation due to the limitations of our tracking tool listed here. Use of this tool is taken entirely at your own risk. All rights reserved.