
House Prices in Takeley
House prices in Takeley have an overall average of £505,758 over the last year.
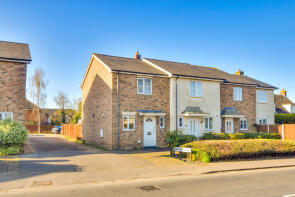
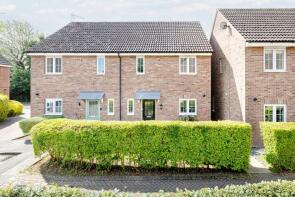
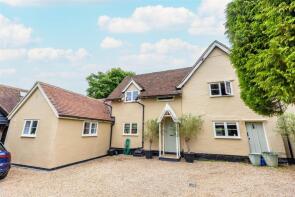
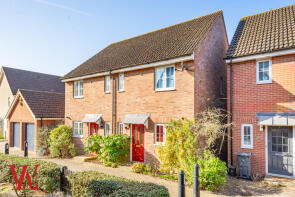
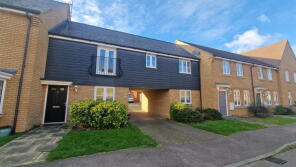
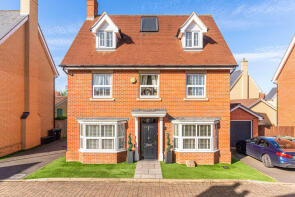
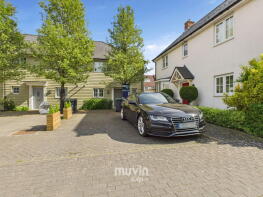
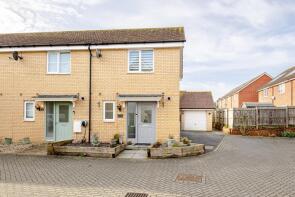
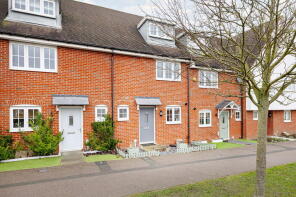
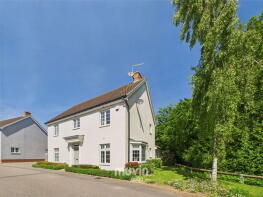
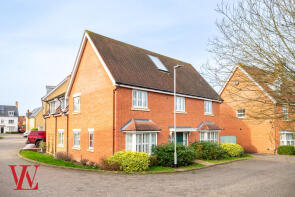
The majority of properties sold in Takeley during the last year were detached properties, selling for an average price of £599,857. Semi-detached properties sold for an average of £421,787, with terraced properties fetching £369,630.
Overall, the historical sold prices in Takeley over the last year were 3% up on the previous year and 1% down on the 2022 peak of £511,694.
Properties Sold
2, Wintershutt Road, Dunmow CM6 1GE
| Today | See what it's worth now |
| 8 Dec 2025 | £290,000 |
| 22 Apr 2008 | £195,995 |
No other historical records.
Wayside, Dunmow Road, Bishop's Stortford CM22 6SL


| Today | See what it's worth now |
| 3 Dec 2025 | £670,000 |
| 15 Mar 2021 | £580,000 |
Lavenhams, Great Canfield Road, Bishop's Stortford CM22 6SU
| Today | See what it's worth now |
| 28 Nov 2025 | £870,000 |
| 14 Jun 2017 | £874,000 |
5, Champneys Way, Dunmow CM6 1FN
| Today | See what it's worth now |
| 21 Nov 2025 | £580,000 |
| 24 May 2013 | £405,000 |
39, Russell Francis Way, Bishop's Stortford CM22 6FQ
| Today | See what it's worth now |
| 19 Nov 2025 | £450,000 |
| 27 Mar 2015 | £359,995 |
No other historical records.
Primrose House, Stortford Road, Dunmow CM6 1SR

| Today | See what it's worth now |
| 7 Nov 2025 | £370,000 |
| 21 Dec 2015 | £234,950 |
No other historical records.
4, Beech Close, Bishop's Stortford CM22 6RQ

| Today | See what it's worth now |
| 29 Oct 2025 | £185,000 |
| 24 Aug 2017 | £175,000 |
No other historical records.
3, Forest Gate, Takeley CM22 6YR

| Today | See what it's worth now |
| 28 Oct 2025 | £638,000 |
No other historical records.
3, Cambridge Cottages, Dunmow Road, Bishop's Stortford CM22 6QH
| Today | See what it's worth now |
| 17 Oct 2025 | £343,000 |
| 23 Sep 2011 | £180,000 |
13, Rumbles Way, Dunmow CM6 1FA
| Today | See what it's worth now |
| 17 Oct 2025 | £385,000 |
| 14 Aug 2015 | £275,000 |
3, The Warren, Stortford Road, Dunmow CM6 1SS
| Today | See what it's worth now |
| 14 Oct 2025 | £625,000 |
| 12 Jan 2017 | £405,000 |
No other historical records.
2, Gilders Road, Dunmow CM6 1UY

| Today | See what it's worth now |
| 6 Oct 2025 | £645,000 |
| 25 Jul 2019 | £525,000 |
52, Clarendon Road, Dunmow CM6 1GA
| Today | See what it's worth now |
| 26 Sep 2025 | £335,000 |
| 28 Nov 2012 | £198,000 |
16, Hubberd Road, Dunmow CM6 1GW
| Today | See what it's worth now |
| 26 Sep 2025 | £272,935 |
| 3 Dec 2009 | £174,995 |
No other historical records.
2, Cam Place, Takeley CM22 6ZA

| Today | See what it's worth now |
| 26 Sep 2025 | £570,000 |
No other historical records.
4, Chapmans Close, Dunmow CM6 1GD
| Today | See what it's worth now |
| 23 Sep 2025 | £560,000 |
| 30 Nov 2018 | £515,000 |
No other historical records.
7, Farmer Close, Dunmow CM6 1HX
| Today | See what it's worth now |
| 12 Sep 2025 | £385,000 |
| 24 Jun 2016 | £348,000 |
24, The Croft, Dunmow CM6 1YD
| Today | See what it's worth now |
| 11 Sep 2025 | £350,000 |
| 10 Mar 2017 | £280,000 |
70, Burgattes Road, Dunmow CM6 1FW
| Today | See what it's worth now |
| 2 Sep 2025 | £379,000 |
| 6 May 2016 | £315,000 |
8, Colemans Close, Dunmow CM6 1TS
| Today | See what it's worth now |
| 2 Sep 2025 | £605,000 |
| 8 Dec 2017 | £490,000 |
16, Franklin Way, Takeley CM22 6YX

| Today | See what it's worth now |
| 29 Aug 2025 | £620,000 |
No other historical records.
5, Long Pond Drive, Takeley CM22 6YZ

| Today | See what it's worth now |
| 29 Aug 2025 | £675,000 |
No other historical records.
39, Burgattes Road, Dunmow CM6 1FW
| Today | See what it's worth now |
| 29 Aug 2025 | £641,000 |
| 28 Aug 2013 | £485,000 |
No other historical records.
Conifers, Hatfield Forest Road, Bush End, Bishop's Stortford CM22 6NE

| Today | See what it's worth now |
| 28 Aug 2025 | £665,000 |
| 30 Apr 2010 | £375,000 |
1, Long Pond Drive, Takeley CM22 6YZ

| Today | See what it's worth now |
| 15 Aug 2025 | £600,000 |
No other historical records.
Source Acknowledgement: © Crown copyright. England and Wales house price data is publicly available information produced by the HM Land Registry.This material was last updated on 4 February 2026. It covers the period from 1 January 1995 to 24 December 2025 and contains property transactions which have been registered during that period. Contains HM Land Registry data © Crown copyright and database right 2026. This data is licensed under the Open Government Licence v3.0.
Disclaimer: Rightmove.co.uk provides this HM Land Registry data "as is". The burden for fitness of the data relies completely with the user and is provided for informational purposes only. No warranty, express or implied, is given relating to the accuracy of content of the HM Land Registry data and Rightmove does not accept any liability for error or omission. If you have found an error with the data or need further information please contact HM Land Registry.
Permitted Use: Viewers of this Information are granted permission to access this Crown copyright material and to download it onto electronic, magnetic, optical or similar storage media provided that such activities are for private research, study or in-house use only. Any other use of the material requires the formal written permission of Land Registry which can be requested from us, and is subject to an additional licence and associated charge.
Map data ©OpenStreetMap contributors.
Rightmove takes no liability for your use of, or reliance on, Rightmove's Instant Valuation due to the limitations of our tracking tool listed here. Use of this tool is taken entirely at your own risk. All rights reserved.