
House Prices in Torrington
House prices in Torrington have an overall average of £237,921 over the last year.
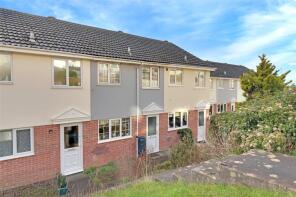
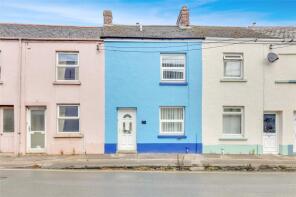
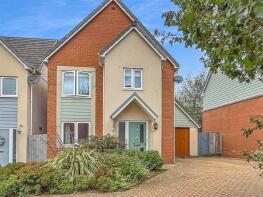
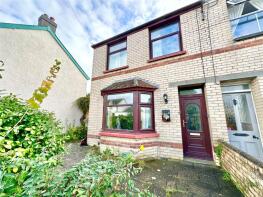
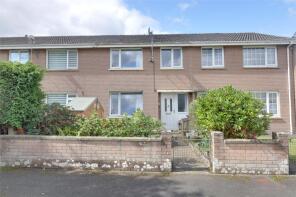
The majority of properties sold in Torrington during the last year were terraced properties, selling for an average price of £206,534. Detached properties sold for an average of £334,937, with semi-detached properties fetching £245,312.
Overall, the historical sold prices in Torrington over the last year were 8% down on the previous year and 5% down on the 2023 peak of £250,390.
Properties Sold
11, Quicks Walk, Torrington EX38 7NR
| Today | See what it's worth now |
| 24 Apr 2026 | £200,000 |
| 23 Aug 2024 | £197,500 |
Flat 2, 13, Well Street, Torrington EX38 8EP
| Today | See what it's worth now |
| 15 Apr 2026 | £75,000 |
| 23 Mar 2007 | £66,000 |
No other historical records.
6, Castle Street, Torrington EX38 8EZ
| Today | See what it's worth now |
| 2 Apr 2026 | £210,000 |
| 8 Feb 2001 | £60,000 |
No other historical records.
13, Greenbank, Torrington EX38 7DP
| Today | See what it's worth now |
| 31 Mar 2026 | £155,000 |
| 29 May 1998 | £32,500 |
42, Mill Street, Torrington EX38 8AN
| Today | See what it's worth now |
| 23 Mar 2026 | £190,000 |
| 30 Apr 2019 | £170,000 |
2, Parkes Road, Torrington EX38 7NW
| Today | See what it's worth now |
| 20 Mar 2026 | £280,000 |
| 9 Aug 2019 | £200,000 |
44, Holwill Drive, Torrington EX38 7LQ
| Today | See what it's worth now |
| 20 Mar 2026 | £265,000 |
| 27 Sep 2024 | £258,000 |
24, Rack Park Close, Torrington EX38 8AH

| Today | See what it's worth now |
| 16 Mar 2026 | £195,500 |
| 14 Apr 2011 | £162,000 |
No other historical records.
16, Holwill Drive, Torrington EX38 7LQ
| Today | See what it's worth now |
| 6 Mar 2026 | £100,000 |
| 19 Feb 2013 | £75,000 |
76, Calf Street, Torrington EX38 7BH
| Today | See what it's worth now |
| 6 Mar 2026 | £182,000 |
| 6 Mar 2026 | £182,000 |
11, Tylers Meadow, Torrington EX38 7BR
| Today | See what it's worth now |
| 17 Feb 2026 | £285,000 |
| 1 Sep 2023 | £275,000 |
91, New Street, Torrington EX38 8BT
| Today | See what it's worth now |
| 16 Feb 2026 | £125,000 |
No other historical records.
5, Cromwell Close, Torrington EX38 7DF
| Today | See what it's worth now |
| 13 Feb 2026 | £350,000 |
| 15 Sep 2006 | £236,750 |
No other historical records.
7 Grenville House, Whites Lane, Torrington EX38 8DS
| Today | See what it's worth now |
| 4 Feb 2026 | £290,000 |
| 2 Dec 2015 | £160,000 |
No other historical records.
5, Goose Green, Torrington EX38 7BP
| Today | See what it's worth now |
| 4 Feb 2026 | £275,000 |
| 28 Mar 2023 | £205,000 |
No other historical records.
41, Greenbank, Torrington EX38 7DP
| Today | See what it's worth now |
| 4 Feb 2026 | £189,000 |
| 18 Oct 2017 | £146,000 |
No other historical records.
25, Fairfax Way, Torrington EX38 7DA
| Today | See what it's worth now |
| 3 Feb 2026 | £377,000 |
| 31 Aug 2005 | £225,000 |
28, Trafalgar Drive, Torrington EX38 7AB
| Today | See what it's worth now |
| 30 Jan 2026 | £225,000 |
| 4 Dec 2006 | £210,000 |
No other historical records.
12, Parkes Road, Torrington EX38 7NW
| Today | See what it's worth now |
| 30 Jan 2026 | £270,000 |
| 11 Feb 2021 | £215,000 |
No other historical records.
29, Calf Street, Torrington EX38 7BG
| Today | See what it's worth now |
| 30 Jan 2026 | £195,000 |
| 14 Dec 2018 | £135,000 |
No other historical records.
6, Victory Way, Torrington EX38 7AR
| Today | See what it's worth now |
| 30 Jan 2026 | £170,000 |
| 4 May 2007 | £139,950 |
No other historical records.
38, Hodges Walk, Torrington EX38 7NP
| Today | See what it's worth now |
| 26 Jan 2026 | £200,000 |
| 30 Sep 2005 | £135,000 |
No other historical records.
27, Fairfax Way, Torrington EX38 7DA
| Today | See what it's worth now |
| 20 Jan 2026 | £425,000 |
| 23 Jul 2013 | £220,000 |
Source Acknowledgement: © Crown copyright. England and Wales house price data is publicly available information produced by the HM Land Registry.This material was last updated on 9 July 2026. It covers the period from 1 January 1995 to 30 April 2026 and contains property transactions which have been registered during that period. Contains HM Land Registry data © Crown copyright and database right 2026. This data is licensed under the Open Government Licence v3.0.
Disclaimer: Rightmove.co.uk provides this HM Land Registry data "as is". The burden for fitness of the data relies completely with the user and is provided for informational purposes only. No warranty, express or implied, is given relating to the accuracy of content of the HM Land Registry data and Rightmove does not accept any liability for error or omission. If you have found an error with the data or need further information please contact HM Land Registry.
Permitted Use: Viewers of this Information are granted permission to access this Crown copyright material and to download it onto electronic, magnetic, optical or similar storage media provided that such activities are for private research, study or in-house use only. Any other use of the material requires the formal written permission of Land Registry which can be requested from us, and is subject to an additional licence and associated charge.
Rightmove takes no liability for your use of, or reliance on, Rightmove's Instant Valuation due to the limitations of our tracking tool listed here. Use of this tool is taken entirely at your own risk. All rights reserved.