
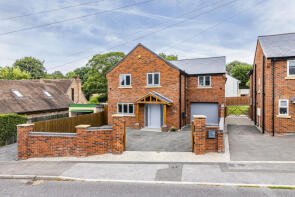
House Prices in Underwood
House prices in Underwood have an overall average of £291,935 over the last year.
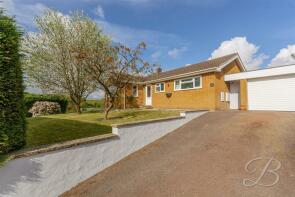
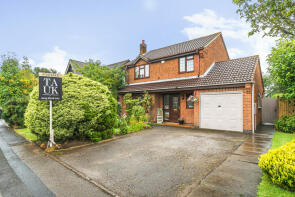
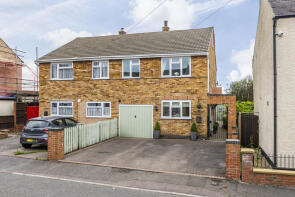
The majority of properties sold in Underwood during the last year were detached properties, selling for an average price of £318,419. Semi-detached properties sold for an average of £193,333, with terraced properties fetching £137,500.
Overall, the historical sold prices in Underwood over the last year were 10% up on the previous year and 4% up on the 2022 peak of £279,412.
Properties Sold
54, Palmerston Street, Nottingham NG16 5GL
| Today | See what it's worth now |
| 21 Nov 2025 | £300,000 |
| 28 May 2014 | £148,000 |
48, Main Road, Nottingham NG16 5GN


| Today | See what it's worth now |
| 5 Nov 2025 | £95,631 |
| 24 Jul 2003 | £74,000 |
No other historical records.
21, Old Chapel Lane, Nottingham NG16 5ET
| Today | See what it's worth now |
| 22 Oct 2025 | £200,000 |
| 27 Feb 2004 | £98,000 |
185, Alfreton Road, Nottingham NG16 5GX
| Today | See what it's worth now |
| 20 Oct 2025 | £180,000 |
| 24 Aug 2018 | £115,000 |
69, Main Road, Nottingham NG16 5GP
| Today | See what it's worth now |
| 26 Sep 2025 | £265,000 |
| 8 Aug 2002 | £95,500 |
No other historical records.
3, Larch Close, Nottingham NG16 5FA
| Today | See what it's worth now |
| 12 Sep 2025 | £480,000 |
| 25 May 2001 | £170,000 |
No other historical records.
7, Smalley Close, Underwood NG16 5GE
| Today | See what it's worth now |
| 12 Sep 2025 | £215,000 |
No other historical records.
7, Beech Court, Nottingham NG16 5ES
| Today | See what it's worth now |
| 29 Aug 2025 | £205,000 |
| 18 Apr 2005 | £125,000 |
No other historical records.
33, Fairview Avenue, Nottingham NG16 5GD

| Today | See what it's worth now |
| 1 Aug 2025 | £295,000 |
| 22 Oct 2004 | £137,500 |
9, Beech Road, Nottingham NG16 5FZ

| Today | See what it's worth now |
| 4 Jul 2025 | £610,000 |
| 22 Aug 2014 | £145,000 |
No other historical records.
6, Main Road, Nottingham NG16 5GF
| Today | See what it's worth now |
| 27 Jun 2025 | £257,500 |
| 12 Dec 2014 | £162,000 |
No other historical records.
1, Sandhill Road, Nottingham NG16 5FX
| Today | See what it's worth now |
| 13 Jun 2025 | £255,000 |
| 25 Sep 2007 | £150,000 |
No other historical records.
19, Smalley Close, Nottingham NG16 5GE
| Today | See what it's worth now |
| 10 Jun 2025 | £270,000 |
| 14 Jul 2000 | £60,000 |
No other historical records.
16, Old Chapel Lane, Underwood NG16 5ET

| Today | See what it's worth now |
| 4 Jun 2025 | £495,000 |
No other historical records.
61, Mansfield Road, Nottingham NG16 5FF

| Today | See what it's worth now |
| 30 May 2025 | £250,000 |
| 1 Mar 2002 | £89,000 |
No other historical records.
118, Mansfield Road, Underwood NG16 5FE
| Today | See what it's worth now |
| 13 May 2025 | £200,000 |
No other historical records.
72, Alfreton Road, Nottingham NG16 5GB
| Today | See what it's worth now |
| 2 May 2025 | £137,500 |
| 23 Aug 2005 | £99,000 |
106b, Church Lane, Nottingham NG16 5FS
| Today | See what it's worth now |
| 25 Mar 2025 | £450,000 |
| 15 Dec 2020 | £280,000 |
No other historical records.
109a, Main Road, Underwood NG16 5GQ
| Today | See what it's worth now |
| 21 Mar 2025 | £310,000 |
No other historical records.
247, Alfreton Road, Nottingham NG16 5GX

| Today | See what it's worth now |
| 19 Mar 2025 | £325,000 |
| 6 Jan 2012 | £125,000 |
20, Westbourne Road, Nottingham NG16 5EG
| Today | See what it's worth now |
| 17 Mar 2025 | £335,000 |
| 18 Aug 2006 | £199,500 |
111, Palmerston Street, Underwood NG16 5GJ

| Today | See what it's worth now |
| 28 Feb 2025 | £250,000 |
No other historical records.
43, Fairview Avenue, Nottingham NG16 5GD

| Today | See what it's worth now |
| 17 Feb 2025 | £285,000 |
| 4 Dec 1998 | £60,000 |
No other historical records.
17, Main Road, Underwood NG16 5GP

| Today | See what it's worth now |
| 7 Feb 2025 | £232,500 |
No other historical records.
66a, Palmerston Street, Nottingham NG16 5GL
| Today | See what it's worth now |
| 22 Jan 2025 | £220,000 |
| 25 Aug 2017 | £122,000 |
Source Acknowledgement: © Crown copyright. England and Wales house price data is publicly available information produced by the HM Land Registry.This material was last updated on 4 February 2026. It covers the period from 1 January 1995 to 24 December 2025 and contains property transactions which have been registered during that period. Contains HM Land Registry data © Crown copyright and database right 2026. This data is licensed under the Open Government Licence v3.0.
Disclaimer: Rightmove.co.uk provides this HM Land Registry data "as is". The burden for fitness of the data relies completely with the user and is provided for informational purposes only. No warranty, express or implied, is given relating to the accuracy of content of the HM Land Registry data and Rightmove does not accept any liability for error or omission. If you have found an error with the data or need further information please contact HM Land Registry.
Permitted Use: Viewers of this Information are granted permission to access this Crown copyright material and to download it onto electronic, magnetic, optical or similar storage media provided that such activities are for private research, study or in-house use only. Any other use of the material requires the formal written permission of Land Registry which can be requested from us, and is subject to an additional licence and associated charge.
Map data ©OpenStreetMap contributors.
Rightmove takes no liability for your use of, or reliance on, Rightmove's Instant Valuation due to the limitations of our tracking tool listed here. Use of this tool is taken entirely at your own risk. All rights reserved.