
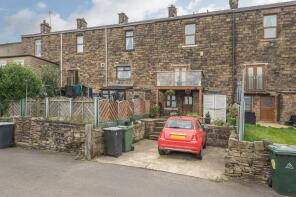
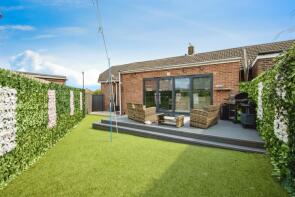
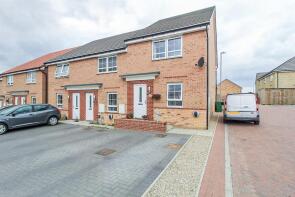
House Prices in WF12
House prices in WF12 have an overall average of £210,214 over the last year.
The majority of properties sold in WF12 during the last year were semi-detached properties, selling for an average price of £201,271. Terraced properties sold for an average of £149,997, with detached properties fetching £331,483.
Overall, the historical sold prices in WF12 over the last year were 1% down on the previous year and 7% up on the 2022 peak of £197,277.
Properties Sold
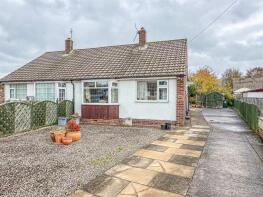
23, Scopsley Lane, Whitley, Dewsbury WF12 0NG
| Today | See what it's worth now |
| 17 Apr 2026 | £188,000 |
| 1 Jul 2016 | £108,500 |
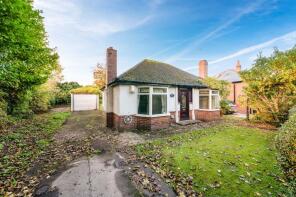
25, Ullswater Road, Dewsbury WF12 7PS
| Today | See what it's worth now |
| 15 Apr 2026 | £240,000 |
| 24 Nov 2000 | £72,000 |
No other historical records.
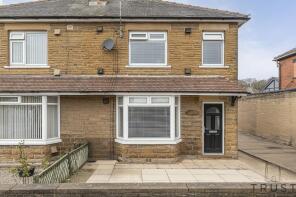
115, Bywell Road, Dewsbury WF12 7LL
| Today | See what it's worth now |
| 14 Apr 2026 | £304,000 |
| 23 Mar 2009 | £166,000 |
No other historical records.
Extensions and planning permission in WF12
See planning approval stats, extension build costs and value added estimates.

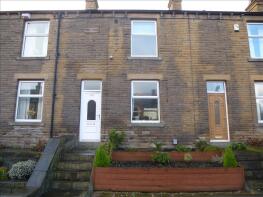
7, Tinsel Road, Dewsbury WF12 7JU
| Today | See what it's worth now |
| 10 Apr 2026 | £180,000 |
No other historical records.
32, Walnut Lane, Chickenley, Dewsbury WF12 8NJ
| Today | See what it's worth now |
| 8 Apr 2026 | £190,000 |
| 21 Feb 2020 | £120,000 |
No other historical records.
103, High Road, Earlsheaton, Dewsbury WF12 8BB
| Today | See what it's worth now |
| 2 Apr 2026 | £199,950 |
| 9 Feb 2018 | £102,000 |
36, Windermere Road, Dewsbury WF12 7PQ
| Today | See what it's worth now |
| 2 Apr 2026 | £260,000 |
| 9 Jun 2000 | £57,000 |
No other historical records.
112, Overthorpe Road, Thornhill, Dewsbury WF12 0RE
| Today | See what it's worth now |
| 2 Apr 2026 | £158,000 |
| 25 Jul 2008 | £95,000 |
18, Kennedy Close, Hanging Heaton, Dewsbury WF12 7EL
| Today | See what it's worth now |
| 1 Apr 2026 | £195,000 |
| 16 Apr 2004 | £113,500 |
No other historical records.
42, Church Lane, Thornhill, Dewsbury WF12 0JZ
| Today | See what it's worth now |
| 30 Mar 2026 | £260,000 |
| 15 Aug 2003 | £67,500 |
No other historical records.
14, Amberwood Chase, Shaw Cross, Dewsbury WF12 7PZ

| Today | See what it's worth now |
| 27 Mar 2026 | £322,000 |
| 20 Nov 2015 | £239,995 |
No other historical records.
1025, Leeds Road, Woodkirk, Dewsbury WF12 7HX
| Today | See what it's worth now |
| 27 Mar 2026 | £210,000 |
| 30 Apr 1998 | £53,000 |
No other historical records.
16, Ennerdale Road, Dewsbury WF12 7NF

| Today | See what it's worth now |
| 27 Mar 2026 | £400,000 |
| 21 Jun 2013 | £225,000 |
431, Lees Hall Road, Thornhill Lees, Dewsbury WF12 9EX
| Today | See what it's worth now |
| 27 Mar 2026 | £52,500 |
| 27 Jun 2014 | £81,000 |
66, Jilling Ing Park, Earlsheaton, Dewsbury WF12 8DN
| Today | See what it's worth now |
| 27 Mar 2026 | £252,500 |
| 16 Sep 2022 | £240,000 |
No other historical records.
40, Hazel Drive, Chickenley, Dewsbury WF12 8PR
| Today | See what it's worth now |
| 25 Mar 2026 | £90,000 |
| 20 Sep 2002 | £47,000 |
No other historical records.
32, Co-operative Street, Chickenley, Dewsbury WF12 8QA
| Today | See what it's worth now |
| 23 Mar 2026 | £190,000 |
| 14 Nov 2018 | £109,500 |
57, Princess Road, Chickenley, Dewsbury WF12 8QX

| Today | See what it's worth now |
| 19 Mar 2026 | £100,000 |
| 30 Nov 2007 | £83,000 |
1005, Leeds Road, Woodkirk, Dewsbury WF12 7HX
| Today | See what it's worth now |
| 13 Mar 2026 | £225,000 |
| 13 Mar 2026 | £225,000 |
36, Elsham Meadows, Earlsheaton, Dewsbury WF12 8LP

| Today | See what it's worth now |
| 12 Mar 2026 | £55,000 |
| 24 Sep 2007 | £108,000 |
24, Thirlmere Road, Dewsbury WF12 7ED
| Today | See what it's worth now |
| 9 Mar 2026 | £295,000 |
| 2 Jun 2006 | £173,000 |
129, Wakefield Road, Earlsheaton, Dewsbury WF12 8AJ

| Today | See what it's worth now |
| 6 Mar 2026 | £75,000 |
| 11 Jan 2008 | £80,500 |
31, The Common, Thornhill, Dewsbury WF12 0LJ
| Today | See what it's worth now |
| 6 Mar 2026 | £150,000 |
| 27 Nov 2015 | £120,000 |
Source Acknowledgement: © Crown copyright. England and Wales house price data is publicly available information produced by the HM Land Registry.This material was last updated on 9 July 2026. It covers the period from 1 January 1995 to 30 April 2026 and contains property transactions which have been registered during that period. Contains HM Land Registry data © Crown copyright and database right 2026. This data is licensed under the Open Government Licence v3.0.
Disclaimer: Rightmove.co.uk provides this HM Land Registry data "as is". The burden for fitness of the data relies completely with the user and is provided for informational purposes only. No warranty, express or implied, is given relating to the accuracy of content of the HM Land Registry data and Rightmove does not accept any liability for error or omission. If you have found an error with the data or need further information please contact HM Land Registry.
Permitted Use: Viewers of this Information are granted permission to access this Crown copyright material and to download it onto electronic, magnetic, optical or similar storage media provided that such activities are for private research, study or in-house use only. Any other use of the material requires the formal written permission of Land Registry which can be requested from us, and is subject to an additional licence and associated charge.
Rightmove takes no liability for your use of, or reliance on, Rightmove's Instant Valuation due to the limitations of our tracking tool listed here. Use of this tool is taken entirely at your own risk. All rights reserved.