
House Prices in Walsingham
House prices in Walsingham have an overall average of £288,400 over the last year.
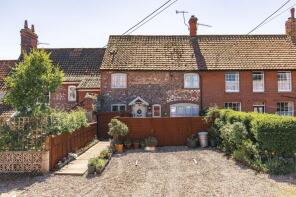
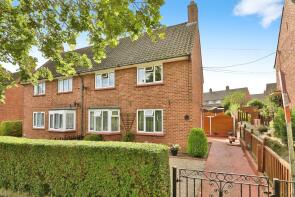
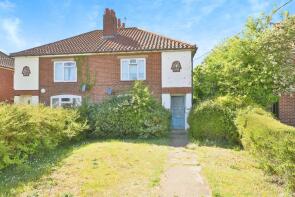
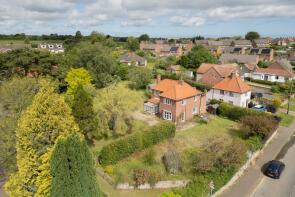
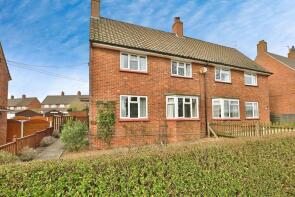
The majority of properties sold in Walsingham during the last year were terraced properties, selling for an average price of £249,500. Detached properties sold for an average of £550,000, with semi-detached properties fetching £143,500.
Overall, the historical sold prices in Walsingham over the last year were 39% down on the previous year and 40% down on the 2022 peak of £482,058.
Properties Sold
37a, High Street, Walsingham NR22 6BZ
| Today | See what it's worth now |
| 12 Dec 2025 | £280,000 |
| 30 Aug 2013 | £170,000 |
41, Wells Road, Walsingham NR22 6DN
| Today | See what it's worth now |
| 28 Nov 2025 | £220,000 |
| 26 Nov 1999 | £17,909 |
No other historical records.
11 13, High Street, Walsingham NR22 6BY

| Today | See what it's worth now |
| 20 Oct 2025 | £248,500 |
| 15 Jan 2015 | £250,000 |
71, Mount Pleasant, Walsingham NR22 6DE
| Today | See what it's worth now |
| 12 Sep 2025 | £143,500 |
| 12 Dec 2022 | £80,000 |
Windsor House, Wells Road, Walsingham NR22 6DL
| Today | See what it's worth now |
| 5 Mar 2025 | £550,000 |
No other historical records.
St Seiriol, 5 Crown Yard, Guild Street, Walsingham NR22 6BU


| Today | See what it's worth now |
| 21 Feb 2025 | £475,000 |
No other historical records.
7-9, High Street, Walsingham NR22 6BY

| Today | See what it's worth now |
| 7 Feb 2025 | £375,000 |
| 19 Jun 2018 | £270,000 |
No other historical records.
43, Wells Road, Walsingham NR22 6DN
| Today | See what it's worth now |
| 16 Dec 2024 | £230,000 |
| 29 Jul 2010 | £130,000 |
No other historical records.
Tudor Cottage, The Old Foundry, Hindringham Road, Walsingham NR22 6DR

| Today | See what it's worth now |
| 28 Oct 2024 | £650,000 |
| 26 Jul 2002 | £295,000 |
No other historical records.
The Old Chapel, Hindringham Road, Walsingham NR22 6DR
| Today | See what it's worth now |
| 10 Sep 2024 | £475,000 |
| 12 Feb 2020 | £320,000 |
No other historical records.
Three Tuns, Scarborough Road, Walsingham NR22 6AB
| Today | See what it's worth now |
| 2 Sep 2024 | £430,000 |
No other historical records.
Mill House, Scarborough Road, Walsingham NR22 6AB
| Today | See what it's worth now |
| 23 Aug 2024 | £650,000 |
No other historical records.
2, Guild Street, Walsingham NR22 6BU

| Today | See what it's worth now |
| 26 Jul 2024 | £635,000 |
| 16 Mar 1998 | £114,000 |
No other historical records.
The Mill, Windmill Farm, Folgate Lane, Walsingham NR22 6BG
| Today | See what it's worth now |
| 19 Jul 2024 | £779,000 |
| 1 Jul 2010 | £625,000 |
29, Cleaves Drive, Walsingham NR22 6EQ

| Today | See what it's worth now |
| 22 Apr 2024 | £407,500 |
| 30 Sep 1997 | £60,000 |
No other historical records.
15a, Wells Road, Walsingham NR22 6DL

| Today | See what it's worth now |
| 15 Mar 2024 | £343,000 |
| 4 Sep 2020 | £299,950 |
15, Cleaves Drive, Walsingham NR22 6EQ

| Today | See what it's worth now |
| 1 Mar 2024 | £193,020 |
| 27 Apr 2009 | £137,500 |
No other historical records.
47, Scarborough Road, Walsingham NR22 6AB

| Today | See what it's worth now |
| 12 Jan 2024 | £268,000 |
No other historical records.
31, High Street, Walsingham NR22 6BZ
| Today | See what it's worth now |
| 15 Nov 2023 | £575,000 |
| 1 Mar 2018 | £420,000 |
No other historical records.
89, Mount Pleasant, Walsingham NR22 6DE

| Today | See what it's worth now |
| 18 Oct 2023 | £193,000 |
No other historical records.
Robin Hood Cottage, Egmere Road, Walsingham NR22 6BT
| Today | See what it's worth now |
| 29 Sep 2023 | £960,000 |
| 21 Dec 1999 | £107,814 |
No other historical records.
Victory Cottage, Swan Entry, Walsingham NR22 6DH

| Today | See what it's worth now |
| 28 Sep 2023 | £450,000 |
| 23 Mar 2016 | £315,000 |
No other historical records.
2 The End Cottage, Egmere Road, Walsingham NR22 6BT
| Today | See what it's worth now |
| 30 Jun 2023 | £345,000 |
| 27 Feb 2015 | £250,000 |
5 The Manse, High Street, Walsingham NR22 6BY

| Today | See what it's worth now |
| 23 Jun 2023 | £563,000 |
| 28 Apr 2015 | £425,000 |
15, St. Peters Road, Walsingham NR22 6DW

| Today | See what it's worth now |
| 31 Mar 2023 | £273,500 |
| 5 Nov 2018 | £182,000 |
No other historical records.
Source Acknowledgement: © Crown copyright. England and Wales house price data is publicly available information produced by the HM Land Registry.This material was last updated on 4 February 2026. It covers the period from 1 January 1995 to 24 December 2025 and contains property transactions which have been registered during that period. Contains HM Land Registry data © Crown copyright and database right 2026. This data is licensed under the Open Government Licence v3.0.
Disclaimer: Rightmove.co.uk provides this HM Land Registry data "as is". The burden for fitness of the data relies completely with the user and is provided for informational purposes only. No warranty, express or implied, is given relating to the accuracy of content of the HM Land Registry data and Rightmove does not accept any liability for error or omission. If you have found an error with the data or need further information please contact HM Land Registry.
Permitted Use: Viewers of this Information are granted permission to access this Crown copyright material and to download it onto electronic, magnetic, optical or similar storage media provided that such activities are for private research, study or in-house use only. Any other use of the material requires the formal written permission of Land Registry which can be requested from us, and is subject to an additional licence and associated charge.
Map data ©OpenStreetMap contributors.
Rightmove takes no liability for your use of, or reliance on, Rightmove's Instant Valuation due to the limitations of our tracking tool listed here. Use of this tool is taken entirely at your own risk. All rights reserved.