
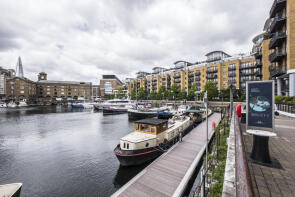
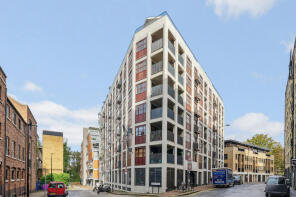
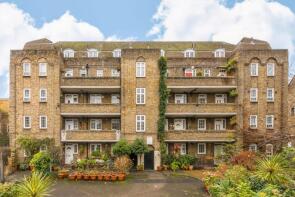
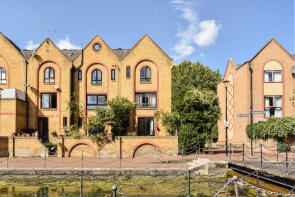
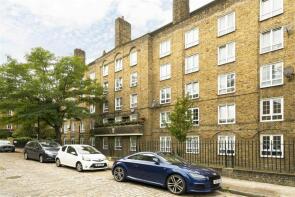
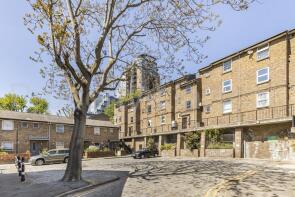
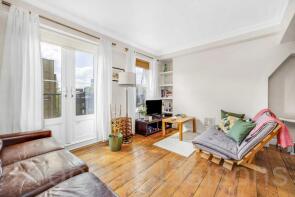
House Prices in Wapping
House prices in Wapping have an overall average of £688,949 over the last year.
The majority of properties sold in Wapping during the last year were flats, selling for an average price of £671,299. Terraced properties sold for an average of £918,389.
Overall, the historical sold prices in Wapping over the last year were 17% down on the previous year and 31% down on the 2022 peak of £999,342.
Properties Sold
41, Newlands Quay, London E1W 3QZ

| Today | See what it's worth now |
| 20 Apr 2026 | £495,000 |
No other historical records.
Flat 14, 123 Falconet Court, Wapping High Street, London E1W 3NX

| Today | See what it's worth now |
| 15 Apr 2026 | £495,000 |
| 3 Jul 1998 | £140,000 |
No other historical records.
Apartment 113, Park Vista Tower, Cobblestone Square, London E1W 3AY

| Today | See what it's worth now |
| 14 Apr 2026 | £395,000 |
No other historical records.
Flat 12, Merganser Court, Star Place, London E1W 1AQ
| Today | See what it's worth now |
| 14 Apr 2026 | £630,000 |
| 15 Apr 1998 | £235,000 |
No other historical records.
Flat 1, Fisher House, Cable Street, London E1 0AW
| Today | See what it's worth now |
| 10 Apr 2026 | £400,000 |
| 17 Mar 2006 | £190,000 |
No other historical records.
Flat 29, 24, Wapping Wall, London E1W 3SE
| Today | See what it's worth now |
| 2 Apr 2026 | £430,000 |
| 3 Jul 2000 | £200,000 |
42, Waterman Way, London E1W 2QW
| Today | See what it's worth now |
| 31 Mar 2026 | £491,000 |
| 10 Dec 2019 | £450,000 |
6, Hawksmoor Mews, London E1 0DG
| Today | See what it's worth now |
| 27 Mar 2026 | £605,000 |
No other historical records.
27, Wapping Wall, London E1W 3SF
| Today | See what it's worth now |
| 27 Mar 2026 | £960,000 |
| 21 Aug 2001 | £405,000 |
Flat 12, Trafalgar Court, Wapping Wall, London E1W 3TF
| Today | See what it's worth now |
| 27 Mar 2026 | £500,000 |
| 7 Nov 2022 | £495,000 |
Flat 304, Riverside Mansions, Milk Yard, London E1W 3TB

| Today | See what it's worth now |
| 20 Mar 2026 | £530,000 |
| 16 Aug 2019 | £500,000 |
Flat 2, 26, Cannon Street Road, London E1 0BH
| Today | See what it's worth now |
| 13 Mar 2026 | £455,000 |
| 1 Mar 2004 | £180,000 |
Flat 35, Tradewinds Court, Asher Way, London E1W 2JB
| Today | See what it's worth now |
| 26 Feb 2026 | £434,000 |
| 15 Aug 2005 | £230,000 |
Flat 301, 12 Luxe Tower, Dock Street, London E1 8QU

| Today | See what it's worth now |
| 26 Feb 2026 | £410,000 |
| 15 Feb 2019 | £586,850 |
No other historical records.
Apartment 207, 5 Park Vista Tower, Cobblestone Square, London E1W 3AY
| Today | See what it's worth now |
| 25 Feb 2026 | £300,001 |
| 12 Mar 2014 | £248,000 |
No other historical records.
Flat 4, Welsh House, Wapping Lane, London E1W 2RP
| Today | See what it's worth now |
| 20 Feb 2026 | £375,000 |
| 26 Mar 2015 | £354,000 |
52, Kennet Street, London E1W 2JJ
| Today | See what it's worth now |
| 20 Feb 2026 | £430,000 |
| 1 Jul 1997 | £108,000 |
No other historical records.
Flat 5, 72 Presidents Quay House, St Katharines Way, London E1W 1UF
| Today | See what it's worth now |
| 16 Feb 2026 | £630,000 |
| 1 Nov 2019 | £665,000 |
Flat 18, 123 Falconet Court, Wapping High Street, London E1W 3NX
| Today | See what it's worth now |
| 16 Feb 2026 | £560,000 |
| 26 Aug 2015 | £570,000 |
132, Kennet Street, London E1W 2JJ
| Today | See what it's worth now |
| 30 Jan 2026 | £1,080,000 |
| 23 Apr 1999 | £249,500 |
No other historical records.
Flat 15, Ross House, Prusom Street, London E1W 3NR
| Today | See what it's worth now |
| 30 Jan 2026 | £405,000 |
No other historical records.
Apartment 307, 5 Counter House, Gauging Square, London E1W 2AE

| Today | See what it's worth now |
| 26 Jan 2026 | £1,020,000 |
| 1 Feb 2017 | £1,464,950 |
No other historical records.
Apartment 515, 5 Park Vista Tower, Cobblestone Square, London E1W 3AZ

| Today | See what it's worth now |
| 26 Jan 2026 | £300,000 |
| 24 Jun 2014 | £380,000 |
Source Acknowledgement: © Crown copyright. England and Wales house price data is publicly available information produced by the HM Land Registry.This material was last updated on 9 July 2026. It covers the period from 1 January 1995 to 30 April 2026 and contains property transactions which have been registered during that period. Contains HM Land Registry data © Crown copyright and database right 2026. This data is licensed under the Open Government Licence v3.0.
Disclaimer: Rightmove.co.uk provides this HM Land Registry data "as is". The burden for fitness of the data relies completely with the user and is provided for informational purposes only. No warranty, express or implied, is given relating to the accuracy of content of the HM Land Registry data and Rightmove does not accept any liability for error or omission. If you have found an error with the data or need further information please contact HM Land Registry.
Permitted Use: Viewers of this Information are granted permission to access this Crown copyright material and to download it onto electronic, magnetic, optical or similar storage media provided that such activities are for private research, study or in-house use only. Any other use of the material requires the formal written permission of Land Registry which can be requested from us, and is subject to an additional licence and associated charge.
Rightmove takes no liability for your use of, or reliance on, Rightmove's Instant Valuation due to the limitations of our tracking tool listed here. Use of this tool is taken entirely at your own risk. All rights reserved.