
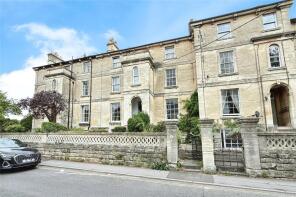
House Prices in Widbrook
House prices in Widbrook have an overall average of £419,150 over the last year.
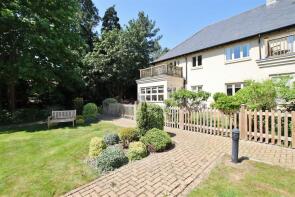
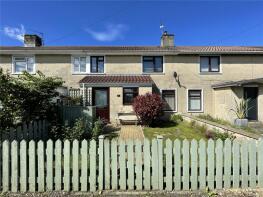
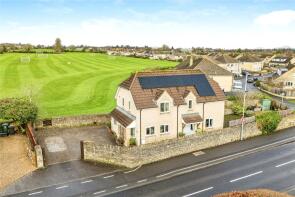
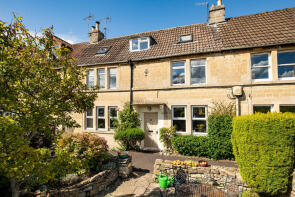
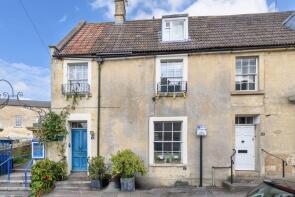
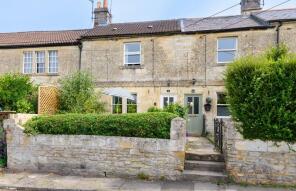
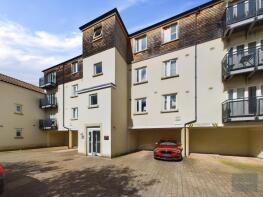
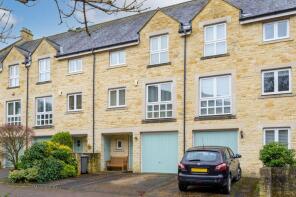
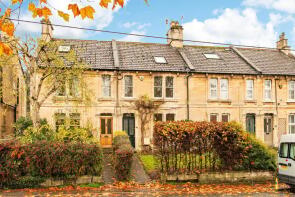
The majority of properties sold in Widbrook during the last year were terraced properties, selling for an average price of £432,812. Semi-detached properties sold for an average of £400,696, with detached properties fetching £590,702.
Overall, the historical sold prices in Widbrook over the last year were 3% down on the previous year and 13% down on the 2022 peak of £480,160.
Properties Sold
9, Cottle Avenue, Bradford-on-avon BA15 1FD
| Today | See what it's worth now |
| 23 Apr 2026 | £360,000 |
| 14 Mar 2014 | £375,000 |
No other historical records.
Flat 3, 30, Silver Street, Bradford-on-avon BA15 1JX
| Today | See what it's worth now |
| 16 Apr 2026 | £235,000 |
No other historical records.
4, Budbury Tyning, Bradford-on-avon BA15 1QE
| Today | See what it's worth now |
| 31 Mar 2026 | £54,000 |
| 13 Sep 2024 | £337,500 |
165, Winsley Road, Bradford-on-avon BA15 1PA
| Today | See what it's worth now |
| 26 Mar 2026 | £610,000 |
| 30 Nov 2021 | £530,000 |
10, Crown Court, Woolley Street, Bradford-on-avon BA15 1BG
| Today | See what it's worth now |
| 26 Mar 2026 | £515,000 |
| 4 Apr 2001 | £230,000 |
7, Kingsfield, Bradford-on-avon BA15 1AN
| Today | See what it's worth now |
| 24 Mar 2026 | £335,000 |
| 30 May 2022 | £295,000 |
89, Winsley Road, Bradford-on-avon BA15 1NZ
| Today | See what it's worth now |
| 20 Mar 2026 | £525,000 |
| 23 Jul 2002 | £171,505 |
No other historical records.
8, Horton Close, Bradford-on-avon BA15 1UG
| Today | See what it's worth now |
| 18 Mar 2026 | £372,000 |
| 24 Jun 2003 | £175,000 |
No other historical records.
2b, Loddon Way, Bradford On Avon BA15 1HG
| Today | See what it's worth now |
| 18 Mar 2026 | £645,000 |
| 17 Dec 2020 | £515,000 |
26, Priory Close, Bradford-on-avon BA15 1QZ
| Today | See what it's worth now |
| 16 Mar 2026 | £270,000 |
| 19 Jan 2024 | £243,000 |
19, Whitehill, Bradford-on-avon BA15 1SG
| Today | See what it's worth now |
| 16 Mar 2026 | £605,000 |
| 29 Sep 2015 | £490,000 |
53, Leigh Park Road, Bradford-on-avon BA15 1TF
| Today | See what it's worth now |
| 12 Mar 2026 | £495,000 |
| 4 Nov 2014 | £315,000 |
56, Whitehill, Bradford-on-avon BA15 1SG
| Today | See what it's worth now |
| 12 Mar 2026 | £720,000 |
| 24 Feb 2021 | £616,500 |
Flat 1, 28, St Margarets Street, Bradford-on-avon BA15 1DN
| Today | See what it's worth now |
| 12 Mar 2026 | £165,000 |
| 13 Jul 2012 | £139,950 |
2b, Silver Street, Bradford-on-avon BA15 1JX
| Today | See what it's worth now |
| 9 Mar 2026 | £240,000 |
| 9 Sep 2016 | £172,500 |
No other historical records.
77, Baileys Barn, Bradford-on-avon BA15 1BW
| Today | See what it's worth now |
| 5 Mar 2026 | £450,000 |
| 4 Nov 2010 | £233,000 |
19 Dolphin House, St Margarets Street, Bradford-on-avon BA15 1DD
| Today | See what it's worth now |
| 27 Feb 2026 | £520,460 |
| 16 Aug 2016 | £430,000 |
Flat 4, 5 Conigre House, Kingsfield Grange Road, Bradford-on-avon BA15 1BE

| Today | See what it's worth now |
| 27 Feb 2026 | £130,000 |
| 29 Apr 2022 | £105,000 |
No other historical records.
5, Woolley Terrace, Bradford-on-avon BA15 1AY
| Today | See what it's worth now |
| 27 Feb 2026 | £330,000 |
| 23 Jan 2015 | £245,000 |
10, Grist Court, Bradford-on-avon BA15 1FJ
| Today | See what it's worth now |
| 27 Feb 2026 | £205,000 |
| 12 Dec 2013 | £179,000 |
11, Greenland Mills, Bradford-on-avon BA15 1BL
| Today | See what it's worth now |
| 26 Feb 2026 | £580,000 |
| 22 Dec 2015 | £435,000 |
Wyngate, Huntingdon Street, Bradford-on-avon BA15 1RQ

| Today | See what it's worth now |
| 26 Feb 2026 | £455,000 |
| 31 Aug 2017 | £321,000 |
134, Trowbridge Road, Bradford-on-avon BA15 1EW
| Today | See what it's worth now |
| 24 Feb 2026 | £539,034 |
| 20 Apr 2018 | £451,200 |
Source Acknowledgement: © Crown copyright. England and Wales house price data is publicly available information produced by the HM Land Registry.This material was last updated on 9 July 2026. It covers the period from 1 January 1995 to 30 April 2026 and contains property transactions which have been registered during that period. Contains HM Land Registry data © Crown copyright and database right 2026. This data is licensed under the Open Government Licence v3.0.
Disclaimer: Rightmove.co.uk provides this HM Land Registry data "as is". The burden for fitness of the data relies completely with the user and is provided for informational purposes only. No warranty, express or implied, is given relating to the accuracy of content of the HM Land Registry data and Rightmove does not accept any liability for error or omission. If you have found an error with the data or need further information please contact HM Land Registry.
Permitted Use: Viewers of this Information are granted permission to access this Crown copyright material and to download it onto electronic, magnetic, optical or similar storage media provided that such activities are for private research, study or in-house use only. Any other use of the material requires the formal written permission of Land Registry which can be requested from us, and is subject to an additional licence and associated charge.
Rightmove takes no liability for your use of, or reliance on, Rightmove's Instant Valuation due to the limitations of our tracking tool listed here. Use of this tool is taken entirely at your own risk. All rights reserved.