
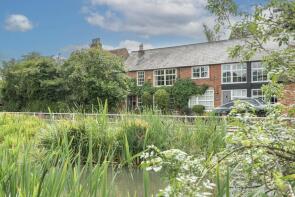
House Prices in Wingrave
House prices in Wingrave have an overall average of £581,269 over the last year.
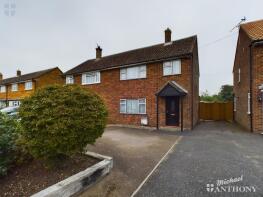
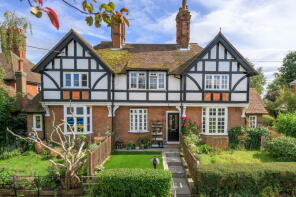
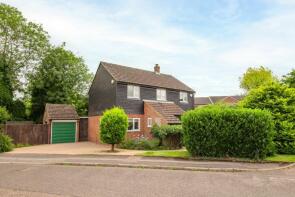
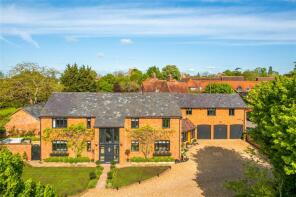
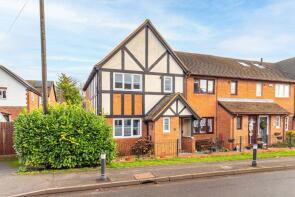
The majority of properties sold in Wingrave during the last year were semi-detached properties, selling for an average price of £498,214. Detached properties sold for an average of £736,000, with terraced properties fetching £389,000.
Overall, the historical sold prices in Wingrave over the last year were similar to the previous year and 2% down on the 2022 peak of £591,488.
Properties Sold
20, Twelve Leys, Aylesbury HP22 4QL
| Today | See what it's worth now |
| 11 Nov 2025 | £415,000 |
| 18 Apr 2008 | £218,000 |
1, Greenacres, Aylesbury HP22 4PW
| Today | See what it's worth now |
| 11 Nov 2025 | £670,000 |
| 3 Jul 2006 | £395,000 |
No other historical records.
4, Parsonage Farm, Aylesbury HP22 4RP
| Today | See what it's worth now |
| 15 Oct 2025 | £595,000 |
| 26 Jul 2006 | £346,000 |
No other historical records.
26 East Lodge, Leighton Road, Aylesbury HP22 4PA


| Today | See what it's worth now |
| 12 Sep 2025 | £900,000 |
| 24 Mar 2021 | £750,000 |
4, The Green, Aylesbury HP22 4PD

| Today | See what it's worth now |
| 29 Aug 2025 | £635,000 |
| 27 May 2004 | £390,000 |
No other historical records.
28, Winslow Road, Aylesbury HP22 4PS
| Today | See what it's worth now |
| 22 Aug 2025 | £762,500 |
| 10 Aug 2016 | £525,000 |
The Old Shop, The Green, Aylesbury HP22 4PD
| Today | See what it's worth now |
| 15 Jul 2025 | £490,000 |
| 22 Sep 2016 | £450,000 |
59, Elm Leys, Aylesbury HP22 4FL
| Today | See what it's worth now |
| 27 Jun 2025 | £490,000 |
| 27 Mar 2020 | £414,995 |
No other historical records.
30, Twelve Leys, Aylesbury HP22 4QL
| Today | See what it's worth now |
| 9 Jun 2025 | £375,000 |
| 19 Dec 2003 | £205,000 |
Rose Cottage, Mill Lane, Wingrave HP22 4PL
| Today | See what it's worth now |
| 28 Mar 2025 | £1,025,000 |
No other historical records.
15, Chiltern Road, Wingrave HP22 4QQ
| Today | See what it's worth now |
| 28 Mar 2025 | £360,000 |
No other historical records.
5, Nup End Lane, Aylesbury HP22 4PX
| Today | See what it's worth now |
| 21 Mar 2025 | £389,000 |
| 11 Nov 2011 | £186,690 |
123a, Winslow Road, Aylesbury HP22 4QB
| Today | See what it's worth now |
| 20 Mar 2025 | £450,000 |
| 20 Jun 2022 | £450,000 |
21, Twelve Leys, Aylesbury HP22 4QL
| Today | See what it's worth now |
| 17 Feb 2025 | £440,000 |
| 26 Sep 2007 | £390,000 |
6, Anershall, Aylesbury HP22 4QH

| Today | See what it's worth now |
| 9 Jan 2025 | £340,000 |
| 30 Jul 2003 | £219,950 |
1, Chiltern Road, Aylesbury HP22 4QQ

| Today | See what it's worth now |
| 2 Aug 2024 | £360,000 |
| 15 Jul 2005 | £190,000 |
No other historical records.
5, Floyds Barns, Mill Lane, Aylesbury HP22 4PL
| Today | See what it's worth now |
| 19 Jul 2024 | £1,250,000 |
| 5 Nov 2021 | £900,000 |
Stile Cottage, Church Street, Wingrave HP22 4PE

| Today | See what it's worth now |
| 19 Jul 2024 | £440,000 |
No other historical records.
18, Mount Tabor Stables, Leighton Road, Aylesbury HP22 4EW

| Today | See what it's worth now |
| 21 Jun 2024 | £590,000 |
| 5 Jul 2018 | £575,000 |
22, Winslow Road, Aylesbury HP22 4PS
| Today | See what it's worth now |
| 14 Jun 2024 | £395,000 |
| 3 Sep 2020 | £323,000 |
20, Wickham Field, Aylesbury HP22 4FR

| Today | See what it's worth now |
| 30 May 2024 | £639,995 |
No other historical records.
9, Wickham Field, Aylesbury HP22 4FR

| Today | See what it's worth now |
| 20 May 2024 | £490,000 |
| 21 Jan 2022 | £466,000 |
No other historical records.
1, The Green, Aylesbury HP22 4PD

| Today | See what it's worth now |
| 30 Apr 2024 | £540,000 |
| 28 Jul 1995 | £109,600 |
No other historical records.
22, Leighton Road, Aylesbury HP22 4PA

| Today | See what it's worth now |
| 27 Mar 2024 | £925,000 |
| 29 Nov 2007 | £650,000 |
19 Vale Cottage, Church Street, Aylesbury HP22 4PE

| Today | See what it's worth now |
| 21 Mar 2024 | £300,000 |
No other historical records.
Source Acknowledgement: © Crown copyright. England and Wales house price data is publicly available information produced by the HM Land Registry.This material was last updated on 4 February 2026. It covers the period from 1 January 1995 to 24 December 2025 and contains property transactions which have been registered during that period. Contains HM Land Registry data © Crown copyright and database right 2026. This data is licensed under the Open Government Licence v3.0.
Disclaimer: Rightmove.co.uk provides this HM Land Registry data "as is". The burden for fitness of the data relies completely with the user and is provided for informational purposes only. No warranty, express or implied, is given relating to the accuracy of content of the HM Land Registry data and Rightmove does not accept any liability for error or omission. If you have found an error with the data or need further information please contact HM Land Registry.
Permitted Use: Viewers of this Information are granted permission to access this Crown copyright material and to download it onto electronic, magnetic, optical or similar storage media provided that such activities are for private research, study or in-house use only. Any other use of the material requires the formal written permission of Land Registry which can be requested from us, and is subject to an additional licence and associated charge.
Map data ©OpenStreetMap contributors.
Rightmove takes no liability for your use of, or reliance on, Rightmove's Instant Valuation due to the limitations of our tracking tool listed here. Use of this tool is taken entirely at your own risk. All rights reserved.