
House Prices in Winwick
House prices in Winwick have an overall average of £387,833 over the last year.
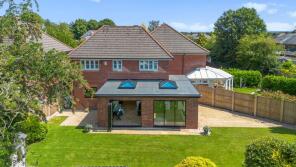
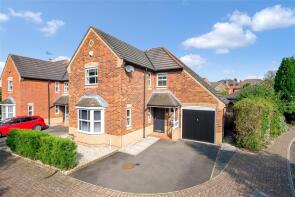
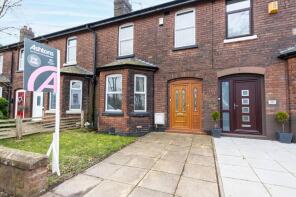
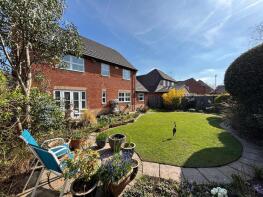
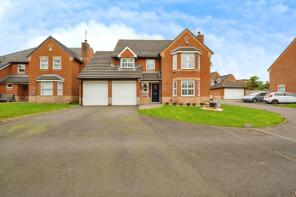
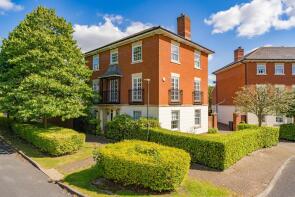
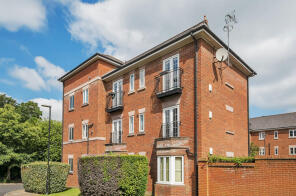
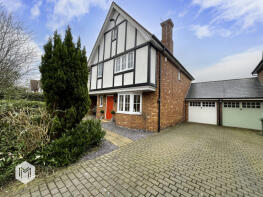
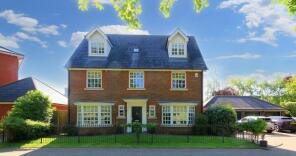
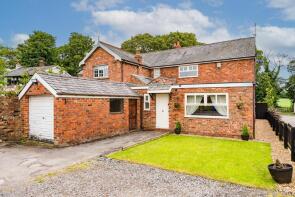
The majority of properties sold in Winwick during the last year were detached properties, selling for an average price of £502,500. Semi-detached properties sold for an average of £308,000, with terraced properties fetching £276,250.
Overall, the historical sold prices in Winwick over the last year were similar to the previous year and 4% down on the 2023 peak of £403,175.
Properties Sold
12, Fleming Drive, Winwick, Warrington WA2 8XP
| Today | See what it's worth now |
| 2 Dec 2025 | £475,000 |
| 29 Jan 2014 | £305,000 |
4, Linkside Avenue, Winwick, Warrington WA2 8NF
| Today | See what it's worth now |
| 26 Nov 2025 | £335,000 |
| 11 Jul 2013 | £181,000 |
No other historical records.
31, Browning Drive, Winwick, Warrington WA2 8XL
| Today | See what it's worth now |
| 27 Oct 2025 | £565,000 |
| 16 Aug 2016 | £320,000 |
32, Faringdon Road, Winwick, Warrington WA2 8NE


| Today | See what it's worth now |
| 8 Oct 2025 | £315,000 |
No other historical records.
23, Browning Drive, Winwick, Warrington WA2 8XL

| Today | See what it's worth now |
| 8 Oct 2025 | £615,000 |
| 16 Apr 2014 | £380,000 |
5, Ilex Avenue, Winwick, Warrington WA2 8LP
| Today | See what it's worth now |
| 22 Sep 2025 | £230,000 |
| 4 Jan 2012 | £125,000 |
23, Austen Drive, Winwick, Warrington WA2 8XE

| Today | See what it's worth now |
| 12 Sep 2025 | £345,000 |
| 13 Jan 2012 | £242,100 |
32, Spires Gardens, Winwick, Warrington WA2 8WB
| Today | See what it's worth now |
| 12 Sep 2025 | £330,000 |
| 15 Sep 2023 | £275,000 |
2, Browning Drive, Winwick, Warrington WA2 8XL
| Today | See what it's worth now |
| 4 Sep 2025 | £410,000 |
| 23 Jul 2010 | £237,500 |
15, Hollins Lane, Winwick, Warrington WA2 8RU
| Today | See what it's worth now |
| 1 Sep 2025 | £222,500 |
No other historical records.
4, Beckett Drive, Winwick, Warrington WA2 8XJ
| Today | See what it's worth now |
| 29 Aug 2025 | £520,000 |
| 17 Nov 2000 | £189,000 |
No other historical records.
42, Falcondale Road, Winwick, Warrington WA2 8NB
| Today | See what it's worth now |
| 19 Aug 2025 | £252,500 |
No other historical records.
12, Gerosa Avenue, Winwick, Warrington WA2 8SR
| Today | See what it's worth now |
| 28 Jul 2025 | £95,000 |
| 8 Jul 2004 | £80,000 |
15, Falcondale Road, Winwick, Warrington WA2 8NB
| Today | See what it's worth now |
| 25 Jul 2025 | £220,000 |
No other historical records.
31, Falcondale Road, Winwick, Warrington WA2 8NB
| Today | See what it's worth now |
| 13 Jun 2025 | £230,000 |
No other historical records.
17, Browning Drive, Winwick, Warrington WA2 8XL
| Today | See what it's worth now |
| 9 Jun 2025 | £505,000 |
| 25 Sep 2015 | £340,000 |
1, Beckett Drive, Winwick, Warrington WA2 8XJ

| Today | See what it's worth now |
| 2 May 2025 | £515,000 |
| 30 Jun 2021 | £400,000 |
17, Winwick Park Avenue, Winwick, Warrington WA2 8XB
| Today | See what it's worth now |
| 31 Mar 2025 | £630,000 |
| 4 Aug 2017 | £505,000 |
41, Ballantyne Place, Winwick, Warrington WA2 8HD
| Today | See what it's worth now |
| 31 Mar 2025 | £148,000 |
| 27 Mar 2002 | £112,950 |
No other historical records.
33, Austen Drive, Winwick, Warrington WA2 8XE
| Today | See what it's worth now |
| 31 Mar 2025 | £415,000 |
| 2 Sep 2022 | £369,000 |
4, Bronte Close, Winwick, Warrington WA2 8XD
| Today | See what it's worth now |
| 31 Mar 2025 | £610,000 |
| 4 Aug 2003 | £420,000 |
4, Cop Holt Cottage, Newton Road, Winwick, Warrington WA2 8SF
| Today | See what it's worth now |
| 21 Mar 2025 | £405,000 |
| 3 Jul 2018 | £277,000 |
No other historical records.
27, Waterworks Lane, Winwick, Warrington WA2 8LH

| Today | See what it's worth now |
| 7 Mar 2025 | £329,995 |
| 20 Apr 2018 | £260,000 |
312, Newton Road, Winwick, Warrington WA2 8LB
| Today | See what it's worth now |
| 3 Mar 2025 | £590,000 |
| 14 Nov 2002 | £225,000 |
No other historical records.
3, Falcondale Road, Winwick, Warrington WA2 8NB
| Today | See what it's worth now |
| 24 Feb 2025 | £305,000 |
No other historical records.
Source Acknowledgement: © Crown copyright. England and Wales house price data is publicly available information produced by the HM Land Registry.This material was last updated on 4 February 2026. It covers the period from 1 January 1995 to 24 December 2025 and contains property transactions which have been registered during that period. Contains HM Land Registry data © Crown copyright and database right 2026. This data is licensed under the Open Government Licence v3.0.
Disclaimer: Rightmove.co.uk provides this HM Land Registry data "as is". The burden for fitness of the data relies completely with the user and is provided for informational purposes only. No warranty, express or implied, is given relating to the accuracy of content of the HM Land Registry data and Rightmove does not accept any liability for error or omission. If you have found an error with the data or need further information please contact HM Land Registry.
Permitted Use: Viewers of this Information are granted permission to access this Crown copyright material and to download it onto electronic, magnetic, optical or similar storage media provided that such activities are for private research, study or in-house use only. Any other use of the material requires the formal written permission of Land Registry which can be requested from us, and is subject to an additional licence and associated charge.
Map data ©OpenStreetMap contributors.
Rightmove takes no liability for your use of, or reliance on, Rightmove's Instant Valuation due to the limitations of our tracking tool listed here. Use of this tool is taken entirely at your own risk. All rights reserved.