
House Prices in Alderholt
House prices in Alderholt have an overall average of £367,190 over the last year.
The majority of properties sold in Alderholt during the last year were detached properties, selling for an average price of £466,067. Semi-detached properties sold for an average of £290,632, with terraced properties fetching £268,500.
Overall, the historical sold prices in Alderholt over the last year were 15% down on the previous year and 17% down on the 2023 peak of £442,000.
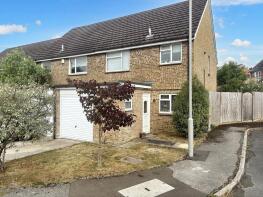
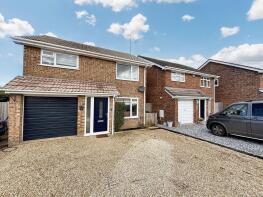
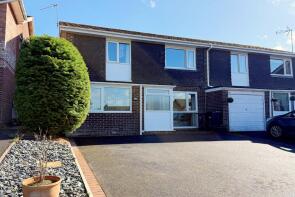
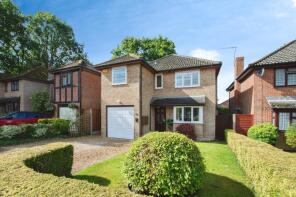
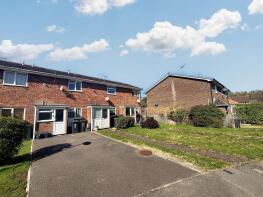
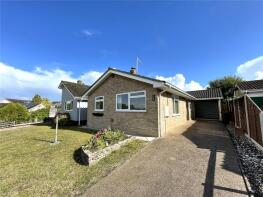
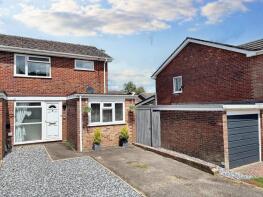
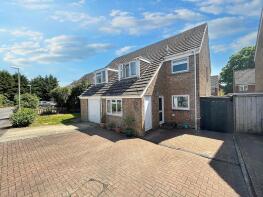
Properties Sold
22, Apple Tree Road, Fordingbridge SP6 3EW
| Today | See what it's worth now |
| 10 Apr 2026 | £285,000 |
| 10 Nov 2006 | £169,000 |
No other historical records.
14b, Pear Tree Close, Fordingbridge SP6 3ER
| Today | See what it's worth now |
| 8 Apr 2026 | £465,000 |
| 11 Dec 2020 | £400,000 |
62, Earlswood Drive, Fordingbridge SP6 3EN
| Today | See what it's worth now |
| 27 Feb 2026 | £134,237 |
| 13 Dec 2013 | £217,000 |
11, Fern Close, Fordingbridge SP6 3HZ
| Today | See what it's worth now |
| 6 Feb 2026 | £400,000 |
| 16 Nov 2022 | £385,000 |
No other historical records.
42, Churchill Close, Fordingbridge SP6 3BG
| Today | See what it's worth now |
| 30 Jan 2026 | £318,000 |
| 20 Jan 2026 | £332,500 |
10, Windsor Way, Fordingbridge SP6 3BN
| Today | See what it's worth now |
| 30 Jan 2026 | £419,000 |
| 16 Apr 2021 | £344,500 |
64, Earlswood Drive, Fordingbridge SP6 3EN
| Today | See what it's worth now |
| 16 Jan 2026 | £370,000 |
| 24 Jul 2020 | £265,000 |
11, Tudor Close, Fordingbridge SP6 3LY
| Today | See what it's worth now |
| 16 Dec 2025 | £465,000 |
| 14 Jul 2011 | £257,500 |
No other historical records.
19, Oak Road, Fordingbridge SP6 3BL
| Today | See what it's worth now |
| 15 Dec 2025 | £284,950 |
| 11 Dec 2020 | £252,500 |
27, Marlow Close, Alderholt SP6 3FL
| Today | See what it's worth now |
| 8 Dec 2025 | £397,000 |
No other historical records.
16, Station Road, Fordingbridge SP6 3RB
| Today | See what it's worth now |
| 28 Nov 2025 | £542,000 |
| 19 Aug 2014 | £350,000 |
Laurel House, Fir Tree Hill, Fordingbridge SP6 3AY
| Today | See what it's worth now |
| 25 Nov 2025 | £510,000 |
| 25 Nov 2014 | £399,950 |
No other historical records.
12, Beech Close, Fordingbridge SP6 3DG
| Today | See what it's worth now |
| 21 Nov 2025 | £448,000 |
| 3 Dec 2018 | £327,000 |
No other historical records.
5, Pear Tree Close, Fordingbridge SP6 3ER
| Today | See what it's worth now |
| 21 Nov 2025 | £247,000 |
| 27 Jun 2017 | £205,000 |
15, Broomfield Drive, Fordingbridge SP6 3HY
| Today | See what it's worth now |
| 20 Nov 2025 | £390,000 |
| 25 Oct 2023 | £380,000 |
27, Earlswood Drive, Fordingbridge SP6 3EN
| Today | See what it's worth now |
| 26 Sep 2025 | £285,000 |
| 11 May 2007 | £170,000 |
No other historical records.
6, Churchill Close, Fordingbridge SP6 3BG
| Today | See what it's worth now |
| 24 Sep 2025 | £324,000 |
| 18 Jan 2022 | £309,000 |
No other historical records.
31, Station Road, Fordingbridge SP6 3RB
| Today | See what it's worth now |
| 12 Sep 2025 | £174,000 |
| 12 Mar 2014 | £107,000 |
The Old Railway Cottage, Daggons Road, Fordingbridge SP6 3TA
| Today | See what it's worth now |
| 10 Sep 2025 | £492,500 |
| 26 Mar 2021 | £390,000 |
3, Pine Road, Alderholt SP6 3BJ
| Today | See what it's worth now |
| 8 Sep 2025 | £200,000 |
No other historical records.
10, Beech Close, Fordingbridge SP6 3DG
| Today | See what it's worth now |
| 1 Sep 2025 | £542,500 |
| 28 Jan 2011 | £310,000 |
17, Alder Drive, Fordingbridge SP6 3EP
| Today | See what it's worth now |
| 29 Aug 2025 | £367,000 |
| 3 Sep 2009 | £189,950 |
Montana, Windsor Way, Alderholt SP6 3BN
| Today | See what it's worth now |
| 27 Aug 2025 | £450,000 |
| 8 Nov 2013 | £249,950 |
No other historical records.

Source Acknowledgement: © Crown copyright. England and Wales house price data is publicly available information produced by the HM Land Registry.This material was last updated on 9 July 2026. It covers the period from 1 January 1995 to 30 April 2026 and contains property transactions which have been registered during that period. Contains HM Land Registry data © Crown copyright and database right 2026. This data is licensed under the Open Government Licence v3.0.
Disclaimer: Rightmove.co.uk provides this HM Land Registry data "as is". The burden for fitness of the data relies completely with the user and is provided for informational purposes only. No warranty, express or implied, is given relating to the accuracy of content of the HM Land Registry data and Rightmove does not accept any liability for error or omission. If you have found an error with the data or need further information please contact HM Land Registry.
Permitted Use: Viewers of this Information are granted permission to access this Crown copyright material and to download it onto electronic, magnetic, optical or similar storage media provided that such activities are for private research, study or in-house use only. Any other use of the material requires the formal written permission of Land Registry which can be requested from us, and is subject to an additional licence and associated charge.
Rightmove takes no liability for your use of, or reliance on, Rightmove's Instant Valuation due to the limitations of our tracking tool listed here. Use of this tool is taken entirely at your own risk. All rights reserved.