
House Prices in Ashtown
House prices in Ashtown have an overall average of £380,583 over the last year.
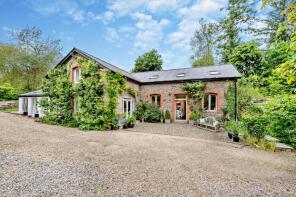
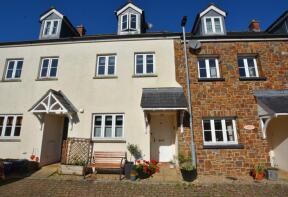
The majority of properties sold in Ashtown during the last year were terraced properties, selling for an average price of £253,143. Detached properties sold for an average of £664,400, with semi-detached properties fetching £324,000.
Overall, the historical sold prices in Ashtown over the last year were 17% down on the previous year and 11% down on the 2021 peak of £426,469.
Properties Sold
8, Bourchier Close, Tiverton EX16 9AG

| Today | See what it's worth now |
| 17 Dec 2025 | £330,000 |
| 17 Jun 2016 | £198,000 |
3, Banfields, Tiverton EX16 9BA
| Today | See what it's worth now |
| 8 Dec 2025 | £200,000 |
| 29 Apr 2009 | £130,000 |
9, Newton Court, Tiverton EX16 9LG
| Today | See what it's worth now |
| 24 Nov 2025 | £255,000 |
| 16 Dec 2005 | £195,500 |
No other historical records.
Littlebrook Cottage, Frog Street, Tiverton EX16 9NT
| Today | See what it's worth now |
| 17 Nov 2025 | £340,000 |
| 20 Mar 2014 | £228,000 |
Lower Bowbier, Bampton EX16 9EE
| Today | See what it's worth now |
| 7 Nov 2025 | £1,100,000 |
No other historical records.
1, Morrells Cross, Morebath EX16 9DA
| Today | See what it's worth now |
| 10 Oct 2025 | £200,000 |
| 22 Feb 2006 | £182,000 |
No other historical records.
The Oaks, South Molton Road, Tiverton EX16 9HU
| Today | See what it's worth now |
| 3 Sep 2025 | £882,000 |
| 15 Nov 2011 | £250,000 |
No other historical records.
6, Woodland Close, Tiverton EX16 9DN
| Today | See what it's worth now |
| 29 Aug 2025 | £136,500 |
| 7 Feb 2017 | £122,000 |
1, Hillcrest, Tiverton EX16 9PJ
| Today | See what it's worth now |
| 26 Aug 2025 | £300,000 |
| 9 Mar 2009 | £165,000 |
6, Ashleigh Park, Tiverton EX16 9LF
| Today | See what it's worth now |
| 31 Jul 2025 | £420,000 |
| 11 Jun 2004 | £360,000 |
No other historical records.
Quartley View, Banfields, Tiverton EX16 9AZ
| Today | See what it's worth now |
| 25 Jul 2025 | £400,000 |
| 10 Jun 2016 | £310,000 |
Moor View, Road From Quoit-at-cross To Dry Hill Cross, Tiverton EX16 9PR
| Today | See what it's worth now |
| 10 Jul 2025 | £590,000 |
| 27 Apr 2017 | £410,000 |
14, Luke Street, Tiverton EX16 9NF

| Today | See what it's worth now |
| 20 Jun 2025 | £235,000 |
| 27 Nov 2015 | £193,000 |
Ivy Cottage, Higher Lurley Cottages, Lurley EX16 9QT
| Today | See what it's worth now |
| 9 Jun 2025 | £312,000 |
| 25 Jul 2013 | £227,000 |
13, Brook Street, Tiverton EX16 9LU
| Today | See what it's worth now |
| 30 May 2025 | £220,000 |
| 22 Mar 2012 | £145,000 |
No other historical records.
Westway, Ford Road, Tiverton EX16 9LW
| Today | See what it's worth now |
| 30 May 2025 | £520,000 |
| 4 Dec 2014 | £265,000 |
2, High Street, Tiverton EX16 9NQ

| Today | See what it's worth now |
| 28 May 2025 | £160,000 |
| 19 Sep 2013 | £203,239 |
No other historical records.
8, Frog Street, Tiverton EX16 9NT
| Today | See what it's worth now |
| 11 Apr 2025 | £250,000 |
| 9 Nov 2020 | £225,000 |
12a, Brook Street, Tiverton EX16 9LY


| Today | See what it's worth now |
| 31 Mar 2025 | £150,000 |
| 4 Jan 2002 | £82,500 |
Court Gardens Cottage, Stoodleigh EX16 9PL
| Today | See what it's worth now |
| 18 Mar 2025 | £532,000 |
No other historical records.
The Long Barn, Washfield EX16 9RF

| Today | See what it's worth now |
| 7 Mar 2025 | £820,000 |
No other historical records.
7, Brook Street, Tiverton EX16 9LU

| Today | See what it's worth now |
| 28 Feb 2025 | £281,500 |
| 26 Nov 2015 | £240,000 |
The Coach House, Holme Place, Road Heading North From The Old School House, Tiverton EX16 9DH
| Today | See what it's worth now |
| 28 Feb 2025 | £1,234,640 |
| 16 Oct 2015 | £610,000 |
Fernbank, Washfield EX16 9RB

| Today | See what it's worth now |
| 21 Feb 2025 | £450,000 |
No other historical records.
8, Newton Court, Tiverton EX16 9LG
| Today | See what it's worth now |
| 20 Feb 2025 | £285,000 |
| 1 Oct 2020 | £220,000 |
Source Acknowledgement: © Crown copyright. England and Wales house price data is publicly available information produced by the HM Land Registry.This material was last updated on 4 February 2026. It covers the period from 1 January 1995 to 24 December 2025 and contains property transactions which have been registered during that period. Contains HM Land Registry data © Crown copyright and database right 2026. This data is licensed under the Open Government Licence v3.0.
Disclaimer: Rightmove.co.uk provides this HM Land Registry data "as is". The burden for fitness of the data relies completely with the user and is provided for informational purposes only. No warranty, express or implied, is given relating to the accuracy of content of the HM Land Registry data and Rightmove does not accept any liability for error or omission. If you have found an error with the data or need further information please contact HM Land Registry.
Permitted Use: Viewers of this Information are granted permission to access this Crown copyright material and to download it onto electronic, magnetic, optical or similar storage media provided that such activities are for private research, study or in-house use only. Any other use of the material requires the formal written permission of Land Registry which can be requested from us, and is subject to an additional licence and associated charge.
Map data ©OpenStreetMap contributors.
Rightmove takes no liability for your use of, or reliance on, Rightmove's Instant Valuation due to the limitations of our tracking tool listed here. Use of this tool is taken entirely at your own risk. All rights reserved.