
House Prices in B27
House prices in B27 have an overall average of £229,919 over the last year.
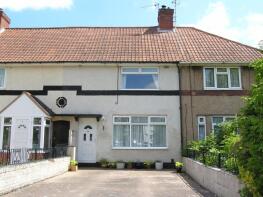
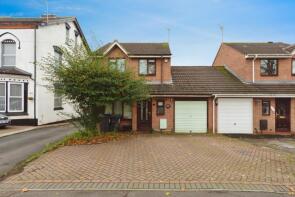
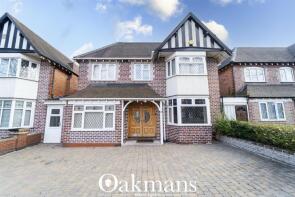
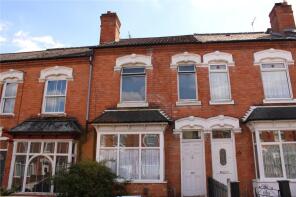
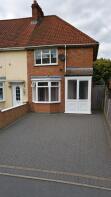
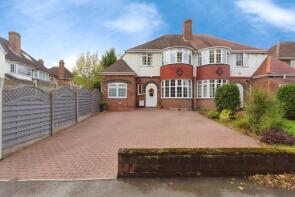
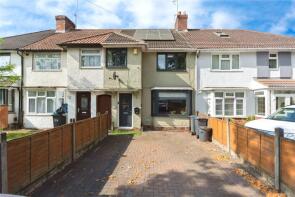
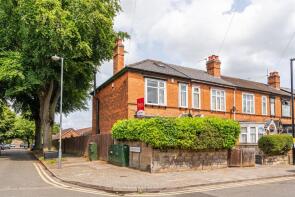
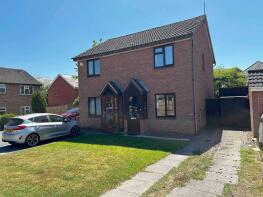
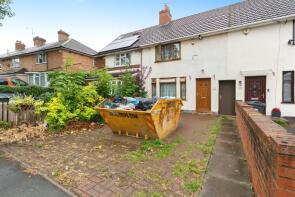
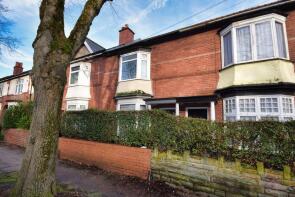
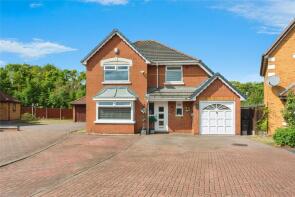
The majority of properties sold in B27 during the last year were terraced properties, selling for an average price of £214,537. Semi-detached properties sold for an average of £245,696, with flats fetching £122,800.
Overall, the historical sold prices in B27 over the last year were similar to the previous year and 5% up on the 2023 peak of £220,012.
Properties Sold
100, Broom Hall Crescent, Birmingham B27 7JS
| Today | See what it's worth now |
| 17 Apr 2026 | £220,000 |
| 26 Jan 2018 | £120,000 |
445, Shirley Road, Acocks Green Olton, Birmingham B27 7NX
| Today | See what it's worth now |
| 15 Apr 2026 | £258,000 |
| 1 Sep 2015 | £217,000 |
38, Victoria Road, Acocks Green Olton, Birmingham B27 7YA
| Today | See what it's worth now |
| 7 Apr 2026 | £550,000 |
| 28 Feb 2019 | £204,000 |
Extensions and planning permission in B27
See planning approval stats, extension build costs and value added estimates.

61, Florence Road, Acocks Green Olton, Birmingham B27 6LN
| Today | See what it's worth now |
| 2 Apr 2026 | £235,000 |
| 1 Feb 2002 | £74,950 |
1247, Warwick Road, Acocks Green Olton, Birmingham B27 6PX

| Today | See what it's worth now |
| 1 Apr 2026 | £250,000 |
| 13 Oct 2020 | £220,000 |
164, Dorsington Road, Olton, Birmingham B27 7AF
| Today | See what it's worth now |
| 1 Apr 2026 | £251,000 |
| 6 Apr 2021 | £165,000 |
32, Hazeltree Croft, Birmingham B27 7XS
| Today | See what it's worth now |
| 27 Mar 2026 | £105,000 |
| 3 Jul 2001 | £63,000 |
82, Stockfield Road, South Yardley, Birmingham B27 6BB
| Today | See what it's worth now |
| 25 Mar 2026 | £230,000 |
| 19 Oct 2018 | £164,000 |
No other historical records.
66, Olton Boulevard East, Birmingham B27 7NG

| Today | See what it's worth now |
| 25 Mar 2026 | £470,000 |
| 26 Jul 2002 | £173,000 |
No other historical records.
40, Northanger Road, Birmingham B27 7RG
| Today | See what it's worth now |
| 24 Mar 2026 | £250,000 |
No other historical records.
37, Cambridge Way, Birmingham B27 6SG
| Today | See what it's worth now |
| 23 Mar 2026 | £358,000 |
| 12 Dec 2013 | £190,000 |
3, Ryde Grove, Birmingham B27 7SW
| Today | See what it's worth now |
| 20 Mar 2026 | £190,000 |
| 9 Jun 2006 | £120,000 |
No other historical records.
4, Overlea Avenue, Birmingham B27 7UN
| Today | See what it's worth now |
| 18 Mar 2026 | £340,500 |
| 12 Aug 2002 | £127,500 |
No other historical records.
1, Ferris Grove, Birmingham B27 7SL

| Today | See what it's worth now |
| 11 Mar 2026 | £245,000 |
| 9 Oct 2015 | £160,000 |
105, Greenwood Avenue, Birmingham B27 7QT
| Today | See what it's worth now |
| 11 Mar 2026 | £232,000 |
No other historical records.
86, Douglas Road, Acocks Green Olton, Birmingham B27 6HP
| Today | See what it's worth now |
| 6 Mar 2026 | £285,000 |
| 8 Nov 2000 | £80,000 |
No other historical records.
14, Olton Croft, Birmingham B27 6PG
| Today | See what it's worth now |
| 6 Mar 2026 | £25,000 |
| 27 Oct 2000 | £80,950 |
No other historical records.
23, Conyworth Close, Birmingham B27 6SA
| Today | See what it's worth now |
| 5 Mar 2026 | £225,000 |
| 14 Jan 2022 | £200,000 |
37, Liddon Road, Birmingham B27 7JB
| Today | See what it's worth now |
| 5 Mar 2026 | £175,000 |
| 27 Jan 2006 | £100,000 |
No other historical records.
185, The Avenue, Acocks Green Olton, Birmingham B27 6NP
| Today | See what it's worth now |
| 2 Mar 2026 | £197,500 |
| 9 Feb 1999 | £51,250 |
No other historical records.
9, Severne Road, Birmingham B27 7HJ
| Today | See what it's worth now |
| 27 Feb 2026 | £207,000 |
| 28 Apr 2023 | £180,000 |
10, Rover Drive, Birmingham B27 6TA
| Today | See what it's worth now |
| 27 Feb 2026 | £470,000 |
| 12 Sep 2003 | £249,950 |
26, Vine Lane, Birmingham B27 6SY
| Today | See what it's worth now |
| 20 Feb 2026 | £170,000 |
| 16 Oct 2023 | £165,000 |
Source Acknowledgement: © Crown copyright. England and Wales house price data is publicly available information produced by the HM Land Registry.This material was last updated on 9 July 2026. It covers the period from 1 January 1995 to 30 April 2026 and contains property transactions which have been registered during that period. Contains HM Land Registry data © Crown copyright and database right 2026. This data is licensed under the Open Government Licence v3.0.
Disclaimer: Rightmove.co.uk provides this HM Land Registry data "as is". The burden for fitness of the data relies completely with the user and is provided for informational purposes only. No warranty, express or implied, is given relating to the accuracy of content of the HM Land Registry data and Rightmove does not accept any liability for error or omission. If you have found an error with the data or need further information please contact HM Land Registry.
Permitted Use: Viewers of this Information are granted permission to access this Crown copyright material and to download it onto electronic, magnetic, optical or similar storage media provided that such activities are for private research, study or in-house use only. Any other use of the material requires the formal written permission of Land Registry which can be requested from us, and is subject to an additional licence and associated charge.
Rightmove takes no liability for your use of, or reliance on, Rightmove's Instant Valuation due to the limitations of our tracking tool listed here. Use of this tool is taken entirely at your own risk. All rights reserved.