
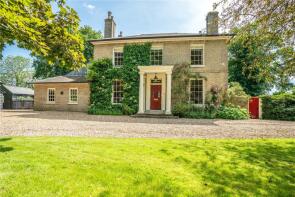
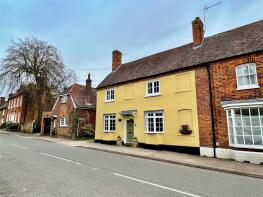
House Prices in Barkway
House prices in Barkway have an overall average of £641,944 over the last year.
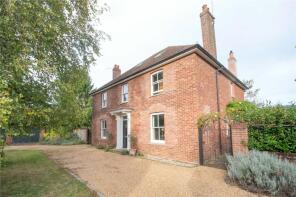
The majority of properties sold in Barkway during the last year were detached properties, selling for an average price of £853,875. Semi-detached properties sold for an average of £486,000, with terraced properties fetching £418,000.
Overall, the historical sold prices in Barkway over the last year were 6% down on the previous year and 5% up on the 2017 peak of £610,933.
Properties Sold
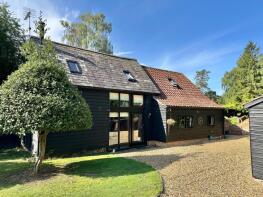
Dashwoods Barn, Church Lane, Royston SG8 8EJ
| Today | See what it's worth now |
| 31 Mar 2026 | £527,500 |
| 31 Mar 2016 | £365,000 |
67, High Street, Royston SG8 8EB
| Today | See what it's worth now |
| 20 Feb 2026 | £843,000 |
| 19 Mar 2021 | £775,000 |
19, Royston Road, Barkway SG8 8BU
| Today | See what it's worth now |
| 17 Dec 2025 | £418,000 |
No other historical records.
1, Stallibrass Mews, High Street, Royston SG8 8EG
| Today | See what it's worth now |
| 7 Nov 2025 | £625,000 |
| 9 Aug 2021 | £525,000 |
3, Chapel Close, Royston SG8 8BY
| Today | See what it's worth now |
| 24 Oct 2025 | £455,000 |
| 20 Feb 2013 | £265,000 |
No other historical records.
99, High Street, Royston SG8 8ED
| Today | See what it's worth now |
| 16 Oct 2025 | £445,000 |
| 16 Oct 2020 | £385,000 |
129, High Street, Royston SG8 8ED
| Today | See what it's worth now |
| 3 Oct 2025 | £419,000 |
| 17 Dec 2021 | £325,000 |
8, Townsend Close, Barkway SG8 8ER
| Today | See what it's worth now |
| 19 Sep 2025 | £370,000 |
No other historical records.
109, High Street, Royston SG8 8ED
| Today | See what it's worth now |
| 28 Jul 2025 | £1,675,000 |
| 24 Aug 2020 | £1,175,000 |
No other historical records.
3, Church Lane, Royston SG8 8EJ
| Today | See what it's worth now |
| 30 Apr 2025 | £181,000 |
| 4 May 2007 | £170,000 |
No other historical records.
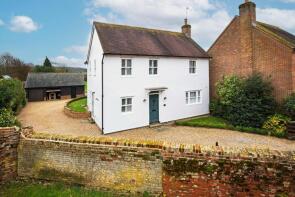
Elms Farm House, High Street, Barkway SG8 8EB
| Today | See what it's worth now |
| 18 Mar 2025 | £1,237,500 |
| 5 Jul 2012 | £630,000 |
No other historical records.
5, High Street, Royston SG8 8EA
| Today | See what it's worth now |
| 7 Mar 2025 | £697,000 |
| 9 Jun 2017 | £575,000 |
No other historical records.
3, Windmill Close, Royston SG8 8BZ

| Today | See what it's worth now |
| 25 Feb 2025 | £412,000 |
| 29 Aug 2012 | £245,000 |
2, The Beeches, High Street, Royston SG8 8EG

| Today | See what it's worth now |
| 14 Feb 2025 | £407,000 |
| 20 Oct 2017 | £445,000 |
Grove House, Highfield Grove, Royston SG8 8DW
| Today | See what it's worth now |
| 19 Dec 2024 | £2,175,000 |
| 12 Apr 2017 | £1,400,000 |
No other historical records.
11, Townsend Close, Royston SG8 8ER

| Today | See what it's worth now |
| 19 Dec 2024 | £540,000 |
| 1 Aug 2006 | £299,950 |
No other historical records.
24a, High Street, Royston SG8 8EE
| Today | See what it's worth now |
| 17 Dec 2024 | £440,000 |
| 6 Jul 2012 | £250,000 |
102, High Street, Royston SG8 8EF
| Today | See what it's worth now |
| 13 Dec 2024 | £300,000 |
| 14 Mar 2016 | £250,000 |
No other historical records.
Bramley Rise, Burrs Lane, Royston SG8 8EP
| Today | See what it's worth now |
| 18 Oct 2024 | £470,000 |
| 18 Dec 2020 | £412,000 |
Trident House, Royston Road, Royston SG8 8BU

| Today | See what it's worth now |
| 4 Oct 2024 | £385,000 |
| 1 Jun 2012 | £261,000 |
Little Thatch, Newsells Village Road, Royston SG8 8DE
| Today | See what it's worth now |
| 30 Sep 2024 | £975,000 |
| 3 Jun 2016 | £785,000 |
No other historical records.
38, Windmill Close, Barkway SG8 8BZ
| Today | See what it's worth now |
| 24 May 2024 | £425,000 |
No other historical records.
15, High Street, Royston SG8 8EA
| Today | See what it's worth now |
| 15 Mar 2024 | £575,000 |
| 4 Aug 2004 | £390,000 |
Source Acknowledgement: © Crown copyright. England and Wales house price data is publicly available information produced by the HM Land Registry.This material was last updated on 9 July 2026. It covers the period from 1 January 1995 to 30 April 2026 and contains property transactions which have been registered during that period. Contains HM Land Registry data © Crown copyright and database right 2026. This data is licensed under the Open Government Licence v3.0.
Disclaimer: Rightmove.co.uk provides this HM Land Registry data "as is". The burden for fitness of the data relies completely with the user and is provided for informational purposes only. No warranty, express or implied, is given relating to the accuracy of content of the HM Land Registry data and Rightmove does not accept any liability for error or omission. If you have found an error with the data or need further information please contact HM Land Registry.
Permitted Use: Viewers of this Information are granted permission to access this Crown copyright material and to download it onto electronic, magnetic, optical or similar storage media provided that such activities are for private research, study or in-house use only. Any other use of the material requires the formal written permission of Land Registry which can be requested from us, and is subject to an additional licence and associated charge.
Rightmove takes no liability for your use of, or reliance on, Rightmove's Instant Valuation due to the limitations of our tracking tool listed here. Use of this tool is taken entirely at your own risk. All rights reserved.