
House Prices in Beverley
House prices in Beverley have an overall average of £269,140 over the last year.
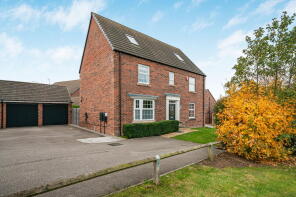
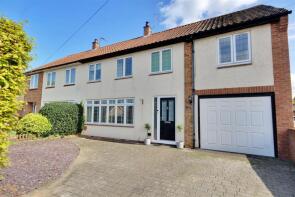
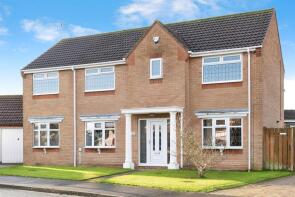
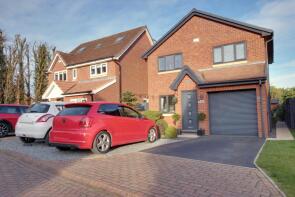
The majority of properties sold in Beverley during the last year were terraced properties, selling for an average price of £217,747. Semi-detached properties sold for an average of £254,201, with detached properties fetching £373,261.
Overall, the historical sold prices in Beverley over the last year were 6% down on the previous year and 7% down on the 2023 peak of £289,571.
Properties Sold
10, Carr Close, Beverley HU17 0QS

| Today | See what it's worth now |
| 17 Apr 2026 | £150,000 |
| 3 Nov 2006 | £115,000 |
20, Foley Avenue, Beverley HU17 8FA
| Today | See what it's worth now |
| 17 Apr 2026 | £575,000 |
| 27 Mar 2025 | £550,000 |
31, St Nicholas Road, Beverley HU17 0EH
| Today | See what it's worth now |
| 17 Apr 2026 | £220,000 |
| 6 Mar 2020 | £227,000 |
52, Wheatlands Drive, Beverley HU17 7HR
| Today | See what it's worth now |
| 17 Apr 2026 | £410,000 |
| 6 Nov 2013 | £200,000 |
No other historical records.
5, Telegraph House, Trinity Lane, Beverley HU17 0DZ
| Today | See what it's worth now |
| 17 Apr 2026 | £150,050 |
| 31 Mar 2003 | £145,000 |
No other historical records.
5, Ponderosa Drive, Beverley HU17 7SU
| Today | See what it's worth now |
| 17 Apr 2026 | £630,000 |
| 29 Apr 2016 | £439,995 |
No other historical records.
5, Squires Croft, Beverley HU17 8XU
| Today | See what it's worth now |
| 17 Apr 2026 | £290,000 |
No other historical records.
26, Molescroft Park, Beverley HU17 7EA
| Today | See what it's worth now |
| 13 Apr 2026 | £410,000 |
| 24 Nov 2017 | £344,000 |
22, Deer Park Way, Beverley HU17 8RN
| Today | See what it's worth now |
| 9 Apr 2026 | £450,000 |
| 30 Jun 1995 | £89,995 |
No other historical records.
1 Deacons Fold, Ripon Avenue, Beverley HU17 8UN

| Today | See what it's worth now |
| 9 Apr 2026 | £400,000 |
| 22 Nov 2006 | £330,000 |
25, Inglefield Close, Beverley HU17 8XG
| Today | See what it's worth now |
| 2 Apr 2026 | £297,500 |
| 4 Aug 2003 | £142,500 |
9, Shepherd Lane, Beverley HU17 8NH

| Today | See what it's worth now |
| 2 Apr 2026 | £295,000 |
| 29 Nov 2019 | £265,000 |
No other historical records.
1, Walker Close, Beverley HU17 0ZS
| Today | See what it's worth now |
| 2 Apr 2026 | £187,000 |
| 25 Aug 2022 | £349,950 |
No other historical records.
6, George Odey Court, Keldgate, Beverley HU17 8HX
| Today | See what it's worth now |
| 2 Apr 2026 | £113,000 |
| 4 Nov 2022 | £112,000 |
47, Highfield Road, Beverley HU17 9QR
| Today | See what it's worth now |
| 2 Apr 2026 | £240,000 |
| 12 Feb 2021 | £220,000 |
7, Voase Way, Beverley HU17 0WL

| Today | See what it's worth now |
| 1 Apr 2026 | £307,000 |
| 29 Jan 2021 | £299,995 |
No other historical records.
15, Rice Close, Beverley HU17 0FU
| Today | See what it's worth now |
| 1 Apr 2026 | £260,000 |
| 17 Nov 2017 | £250,000 |
No other historical records.
2, Woodlands, Beverley HU17 8BX
| Today | See what it's worth now |
| 1 Apr 2026 | £270,000 |
| 1 Aug 2008 | £189,000 |
14, Goulding Court, Beverley HU17 9FE
| Today | See what it's worth now |
| 31 Mar 2026 | £195,000 |
| 28 Aug 2024 | £175,000 |
98, Grovehill Road, Beverley HU17 0ER
| Today | See what it's worth now |
| 30 Mar 2026 | £280,000 |
| 30 Oct 2019 | £248,000 |
2, Highfield Road, Beverley HU17 9QN

| Today | See what it's worth now |
| 30 Mar 2026 | £264,650 |
| 6 Nov 1998 | £57,250 |
3, Plimpton Mead, Beverley HU17 0WE
| Today | See what it's worth now |
| 27 Mar 2026 | £206,000 |
| 20 May 2024 | £220,000 |
No other historical records.
15, Ascott Close, Beverley HU17 9TA
| Today | See what it's worth now |
| 27 Mar 2026 | £368,750 |
| 20 Nov 2007 | £245,000 |
Source Acknowledgement: © Crown copyright. England and Wales house price data is publicly available information produced by the HM Land Registry.This material was last updated on 9 July 2026. It covers the period from 1 January 1995 to 30 April 2026 and contains property transactions which have been registered during that period. Contains HM Land Registry data © Crown copyright and database right 2026. This data is licensed under the Open Government Licence v3.0.
Disclaimer: Rightmove.co.uk provides this HM Land Registry data "as is". The burden for fitness of the data relies completely with the user and is provided for informational purposes only. No warranty, express or implied, is given relating to the accuracy of content of the HM Land Registry data and Rightmove does not accept any liability for error or omission. If you have found an error with the data or need further information please contact HM Land Registry.
Permitted Use: Viewers of this Information are granted permission to access this Crown copyright material and to download it onto electronic, magnetic, optical or similar storage media provided that such activities are for private research, study or in-house use only. Any other use of the material requires the formal written permission of Land Registry which can be requested from us, and is subject to an additional licence and associated charge.
Rightmove takes no liability for your use of, or reliance on, Rightmove's Instant Valuation due to the limitations of our tracking tool listed here. Use of this tool is taken entirely at your own risk. All rights reserved.