
House Prices in Surrey Road, Bournemouth, Bournemouth Christchurch Poole, BH4
House prices in Surrey Road have an overall average of £254,067 over the last year.
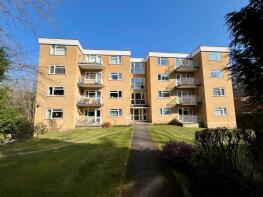
The majority of properties sold in Surrey Road during the last year were flats, selling for an average price of £241,143. Terraced properties sold for an average of £435,000.
Overall, the historical sold prices in Surrey Road over the last year were 7% up on the previous year and 10% up on the 2022 peak of £231,568.
Properties Sold
12, 39 Treetops, Surrey Road, Bournemouth BH4 9HR
| Today | See what it's worth now |
| 9 Mar 2026 | £195,000 |
| 13 Nov 2019 | £175,000 |
Flat 8, 48, Surrey Road, Bournemouth BH4 9HT
| Today | See what it's worth now |
| 30 Jan 2026 | £195,000 |
| 15 Jun 2021 | £180,000 |
46c, Surrey Road, Bournemouth BH4 9HT
| Today | See what it's worth now |
| 6 Jan 2026 | £435,000 |
| 21 Mar 2022 | £417,000 |
Extensions and planning permission in BH4
See planning approval stats, extension build costs and value added estimates.

10, 45 Garden Court, Surrey Road, Bournemouth BH4 9HR

| Today | See what it's worth now |
| 3 Dec 2025 | £235,000 |
| 22 Oct 2021 | £235,000 |
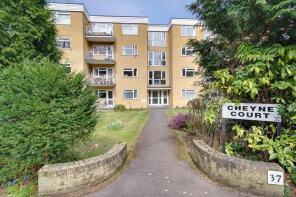
8, 37 Cheyne Court, Surrey Road, Bournemouth BH4 9HR
| Today | See what it's worth now |
| 24 Oct 2025 | £258,000 |
| 1 Jun 2006 | £189,000 |
5, 37 Cheyne Court, Surrey Road, Bournemouth BH4 9HR
| Today | See what it's worth now |
| 24 Oct 2025 | £260,000 |
| 26 Apr 2019 | £255,000 |
9, 40 Westbury Gardens, Surrey Road, Bournemouth BH4 9BX
| Today | See what it's worth now |
| 6 Oct 2025 | £215,000 |
| 26 Jul 2001 | £141,500 |
No other historical records.
18, 51 53 Kernella Court, Surrey Road, Bournemouth BH4 9HS

| Today | See what it's worth now |
| 26 Sep 2025 | £305,000 |
| 22 Jul 2022 | £337,000 |
16, Cheyne Court, Surrey Road, Bournemouth BH4 9HR
| Today | See what it's worth now |
| 19 Sep 2025 | £220,000 |
No other historical records.
3, 70 Amarone, Surrey Road, Bournemouth BH4 9FW
| Today | See what it's worth now |
| 18 Sep 2025 | £210,000 |
| 26 Jan 2015 | £195,000 |
Garden Flat, 27a Miami Court, Surrey Road, Bournemouth BH4 9HW
| Today | See what it's worth now |
| 1 Sep 2025 | £312,500 |
| 2 Nov 2018 | £195,000 |
Flat 7, 48, Surrey Road, Bournemouth BH4 9HT
| Today | See what it's worth now |
| 11 Aug 2025 | £218,000 |
| 9 Oct 2020 | £180,000 |
9, 53a Surrey Keep, Surrey Road, Bournemouth BH4 9HS
| Today | See what it's worth now |
| 8 Aug 2025 | £263,000 |
| 27 Apr 2012 | £195,000 |
No other historical records.
9, 62 Surrey Towers, Surrey Road, Bournemouth BH4 9HT

| Today | See what it's worth now |
| 31 Jul 2025 | £239,500 |
| 6 Dec 1996 | £52,000 |
No other historical records.
21, 51 53 Kernella Court, Surrey Road, Bournemouth BH4 9HS
| Today | See what it's worth now |
| 21 Jul 2025 | £250,000 |
| 29 Oct 2013 | £205,000 |
D3, Woodside, Surrey Road, Bournemouth BH4 9HS
| Today | See what it's worth now |
| 28 May 2025 | £155,000 |
| 12 Aug 2014 | £134,000 |
No other historical records.
8, 62 Surrey Towers, Surrey Road, Bournemouth BH4 9HT
| Today | See what it's worth now |
| 23 May 2025 | £307,500 |
| 6 Nov 2018 | £265,000 |
4, 53a Surrey Keep, Surrey Road, Bournemouth BH4 9HS
| Today | See what it's worth now |
| 16 May 2025 | £255,000 |
| 23 Dec 2019 | £210,000 |
Flat 11, 13 Earlsdon Lodge, Surrey Road, Bournemouth BH2 6BP
| Today | See what it's worth now |
| 9 May 2025 | £155,000 |
| 19 Mar 2015 | £147,500 |
11, 19 Surrey Lodge, Surrey Road, Bournemouth BH4 9HN
| Today | See what it's worth now |
| 8 May 2025 | £300,000 |
| 15 Dec 2020 | £260,000 |
No other historical records.
2, 5 7 Otterbourne, Surrey Road, Bournemouth BH2 6BP
| Today | See what it's worth now |
| 2 May 2025 | £250,000 |
| 12 Nov 2021 | £245,000 |
Flat 2, 33 Surrey Dene, Surrey Road, Bournemouth BH4 9HR
| Today | See what it's worth now |
| 28 Mar 2025 | £190,500 |
| 2 Aug 2019 | £172,500 |
7, 5 7 Otterbourne, Surrey Road, Bournemouth BH2 6BP
| Today | See what it's worth now |
| 26 Mar 2025 | £235,000 |
| 26 May 2010 | £168,000 |
Source Acknowledgement: © Crown copyright. England and Wales house price data is publicly available information produced by the HM Land Registry.This material was last updated on 15 May 2026. It covers the period from 1 January 1995 to 31 March 2026 and contains property transactions which have been registered during that period. Contains HM Land Registry data © Crown copyright and database right 2026. This data is licensed under the Open Government Licence v3.0.
Disclaimer: Rightmove.co.uk provides this HM Land Registry data "as is". The burden for fitness of the data relies completely with the user and is provided for informational purposes only. No warranty, express or implied, is given relating to the accuracy of content of the HM Land Registry data and Rightmove does not accept any liability for error or omission. If you have found an error with the data or need further information please contact HM Land Registry.
Permitted Use: Viewers of this Information are granted permission to access this Crown copyright material and to download it onto electronic, magnetic, optical or similar storage media provided that such activities are for private research, study or in-house use only. Any other use of the material requires the formal written permission of Land Registry which can be requested from us, and is subject to an additional licence and associated charge.
Map data ©OpenStreetMap contributors.
Rightmove takes no liability for your use of, or reliance on, Rightmove's Instant Valuation due to the limitations of our tracking tool listed here. Use of this tool is taken entirely at your own risk. All rights reserved.