
House Prices in Bickerley Common
House prices in Bickerley Common have an overall average of £417,636 over the last year.
The majority of properties sold in Bickerley Common during the last year were semi-detached properties, selling for an average price of £403,060. Detached properties sold for an average of £570,913, with flats fetching £194,644.
Overall, the historical sold prices in Bickerley Common over the last year were 12% up on the previous year and 7% up on the 2023 peak of £390,164.
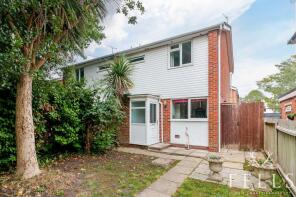
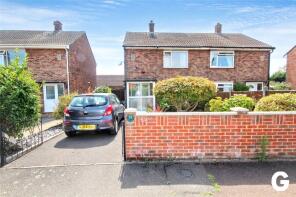
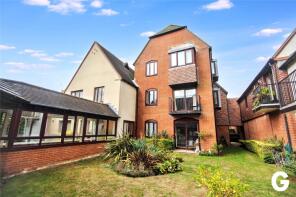
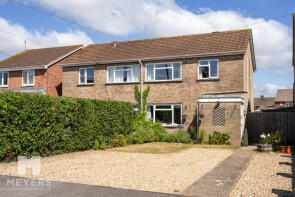
Properties Sold
30 Kentdale, Kings Arms Lane, Ringwood BH24 1AH
| Today | See what it's worth now |
| 18 Mar 2026 | £312,000 |
| 19 Dec 2013 | £235,000 |
82 Madeira Lodge, Northfield Road, Ringwood BH24 1ST

| Today | See what it's worth now |
| 13 Mar 2026 | £625,000 |
| 9 Dec 2021 | £575,000 |
73, Spittlefields, Ringwood BH24 1QH
| Today | See what it's worth now |
| 2 Mar 2026 | £305,000 |
No other historical records.
16a, Parsonage Barn Lane, Ringwood BH24 1PX

| Today | See what it's worth now |
| 2 Mar 2026 | £315,000 |
| 14 Mar 2014 | £205,000 |
17, White Lion Courtyard, Deweys Lane, Ringwood BH24 1AJ
| Today | See what it's worth now |
| 26 Feb 2026 | £92,000 |
| 1 Apr 2022 | £105,000 |
7, Old Barn Close, Ringwood BH24 1XF
| Today | See what it's worth now |
| 20 Feb 2026 | £360,000 |
| 28 Mar 2022 | £340,000 |
No other historical records.
44, Victoria Gardens, Ringwood BH24 1FD
| Today | See what it's worth now |
| 12 Feb 2026 | £420,000 |
| 28 Jul 2023 | £399,950 |
4, Hiltom Road, Ringwood BH24 1PW

| Today | See what it's worth now |
| 12 Feb 2026 | £700,000 |
| 5 Mar 2021 | £580,000 |
35, White Lion Courtyard, Deweys Lane, Ringwood BH24 1AJ
| Today | See what it's worth now |
| 6 Feb 2026 | £101,000 |
| 22 Mar 2013 | £135,000 |
45, Euston Grove, Ringwood BH24 1FB
| Today | See what it's worth now |
| 6 Feb 2026 | £300,000 |
| 28 Mar 2000 | £54,000 |
No other historical records.
48, Croft Road, Ringwood BH24 1TA
| Today | See what it's worth now |
| 2 Feb 2026 | £360,000 |
| 23 Mar 2012 | £248,000 |
10, Raleigh Close, Ringwood BH24 1XP

| Today | See what it's worth now |
| 26 Jan 2026 | £387,500 |
| 16 Nov 2017 | £260,000 |
No other historical records.
202, Southampton Road, Ringwood BH24 1JG

| Today | See what it's worth now |
| 26 Jan 2026 | £460,000 |
| 8 Nov 2002 | £243,000 |
1, Drake Close, Ringwood BH24 1UG
| Today | See what it's worth now |
| 20 Jan 2026 | £345,000 |
| 28 Oct 2010 | £193,000 |
No other historical records.
32, College Road, Ringwood BH24 1NX
| Today | See what it's worth now |
| 16 Jan 2026 | £682,000 |
| 27 Apr 2021 | £650,000 |
2, Kings House, Kings Arms Lane, Ringwood BH24 1AH
| Today | See what it's worth now |
| 15 Jan 2026 | £150,000 |
No other historical records.
40, The Mount, Ringwood BH24 1XY
| Today | See what it's worth now |
| 9 Jan 2026 | £405,000 |
| 2 Mar 2018 | £318,000 |
25, Orchard Close, Ringwood BH24 1LP
| Today | See what it's worth now |
| 9 Jan 2026 | £408,000 |
| 4 Aug 2021 | £395,000 |
34, Kingsburys Lane, Ringwood BH24 1EL
| Today | See what it's worth now |
| 19 Dec 2025 | £320,000 |
| 22 Mar 2019 | £287,500 |
26, Forestside Gardens, Ringwood BH24 1SZ
| Today | See what it's worth now |
| 17 Dec 2025 | £310,000 |
| 26 Jan 2006 | £187,000 |
20, Westbury Road, Ringwood BH24 1PG
| Today | See what it's worth now |
| 12 Dec 2025 | £575,000 |
No other historical records.
12, 2 Cornmantle Court, Parsonage Barn Lane, Ringwood BH24 1WJ
| Today | See what it's worth now |
| 12 Dec 2025 | £270,000 |
| 27 Feb 2015 | £295,000 |
No other historical records.
5, Brooks Close, Ringwood BH24 1NE
| Today | See what it's worth now |
| 12 Dec 2025 | £350,000 |
| 26 Apr 2016 | £245,000 |
No other historical records.
11, Deweys Lane, Ringwood BH24 1AJ
| Today | See what it's worth now |
| 11 Dec 2025 | £447,500 |
| 20 Mar 2020 | £445,000 |
5, Frobisher Close, Ringwood BH24 1UH
| Today | See what it's worth now |
| 11 Dec 2025 | £403,000 |
| 8 Sep 2004 | £219,950 |
No other historical records.
Source Acknowledgement: © Crown copyright. England and Wales house price data is publicly available information produced by the HM Land Registry.This material was last updated on 15 May 2026. It covers the period from 1 January 1995 to 31 March 2026 and contains property transactions which have been registered during that period. Contains HM Land Registry data © Crown copyright and database right 2026. This data is licensed under the Open Government Licence v3.0.
Disclaimer: Rightmove.co.uk provides this HM Land Registry data "as is". The burden for fitness of the data relies completely with the user and is provided for informational purposes only. No warranty, express or implied, is given relating to the accuracy of content of the HM Land Registry data and Rightmove does not accept any liability for error or omission. If you have found an error with the data or need further information please contact HM Land Registry.
Permitted Use: Viewers of this Information are granted permission to access this Crown copyright material and to download it onto electronic, magnetic, optical or similar storage media provided that such activities are for private research, study or in-house use only. Any other use of the material requires the formal written permission of Land Registry which can be requested from us, and is subject to an additional licence and associated charge.
Map data ©OpenStreetMap contributors.
Rightmove takes no liability for your use of, or reliance on, Rightmove's Instant Valuation due to the limitations of our tracking tool listed here. Use of this tool is taken entirely at your own risk. All rights reserved.