
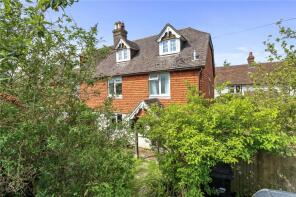
House Prices in Blackboys
House prices in Blackboys have an overall average of £580,000 over the last year.
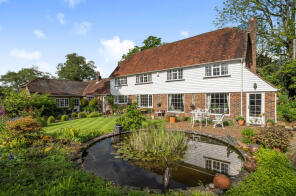
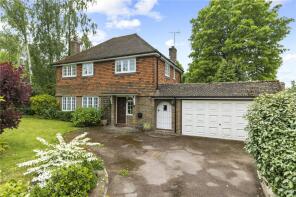
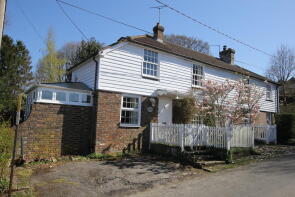
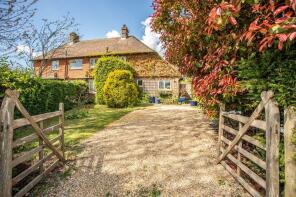
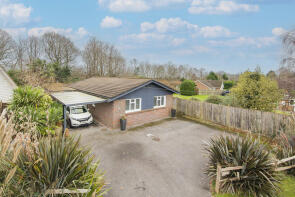
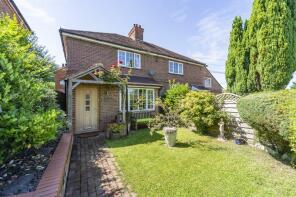
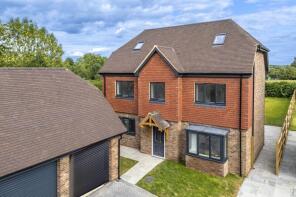
The majority of properties sold in Blackboys during the last year were detached properties, selling for an average price of £706,667. Semi-detached properties sold for an average of £453,333.
Overall, the historical sold prices in Blackboys over the last year were 14% down on the previous year and 21% down on the 2021 peak of £738,667.
Properties Sold
The Barn, High Street, Blackboys TN22 5JU
| Today | See what it's worth now |
| 6 Feb 2026 | £900,000 |
No other historical records.
8, The Green, Uckfield TN22 5LP
| Today | See what it's worth now |
| 19 Sep 2025 | £740,000 |
| 8 Dec 2020 | £667,500 |
2, Rose Cottage, Gun Road, Blackboys TN22 5JY
| Today | See what it's worth now |
| 10 Sep 2025 | £435,000 |
No other historical records.
17, Maple Leaf Cottages, School Lane, Uckfield TN22 5LJ
| Today | See what it's worth now |
| 4 Sep 2025 | £425,000 |
| 18 Sep 2020 | £377,333 |
2, Tickerage Lane, Uckfield TN22 5LT
| Today | See what it's worth now |
| 29 Jul 2025 | £500,000 |
| 10 Dec 2020 | £422,500 |
The Haven, High Street, Uckfield TN22 5JS
| Today | See what it's worth now |
| 18 Jul 2025 | £480,000 |
| 8 Sep 2020 | £390,000 |
3, Tickerage Lane, Uckfield TN22 5LT
| Today | See what it's worth now |
| 28 Mar 2025 | £435,000 |
| 10 Oct 2014 | £300,000 |
6, The Coachworks, Uckfield TN22 5LF
| Today | See what it's worth now |
| 27 Mar 2025 | £427,500 |
| 8 Nov 2019 | £390,000 |
No other historical records.
The Grange, High Street, Uckfield TN22 5JU
| Today | See what it's worth now |
| 21 Mar 2025 | £1,070,000 |
| 14 Aug 2015 | £1,100,000 |
No other historical records.
Bakery Cottage, Framfield Road, Blackboys TN22 5LR
| Today | See what it's worth now |
| 21 Mar 2025 | £385,000 |
No other historical records.
1, Maple Leaf Cottages, Framfield Road, Blackboys TN22 5LR
| Today | See what it's worth now |
| 13 Mar 2025 | £397,000 |
No other historical records.
2, Willow Cottage, Gun Road, Blackboys TN22 5JZ
| Today | See what it's worth now |
| 7 Feb 2025 | £375,000 |
No other historical records.
Highfields, Chapel Lane, Uckfield TN22 5LB
| Today | See what it's worth now |
| 29 Jan 2025 | £580,000 |
| 22 Sep 2017 | £695,000 |
Firethorn House, High Street, Uckfield TN22 5JS
| Today | See what it's worth now |
| 17 Jan 2025 | £485,000 |
| 20 Jul 2017 | £395,000 |
Old Barn Cottage, Stonebridge Lane, Uckfield TN22 5HX

| Today | See what it's worth now |
| 28 Oct 2024 | £585,000 |
| 7 Dec 2007 | £450,000 |
Thymari, High Street, Uckfield TN22 5JU

| Today | See what it's worth now |
| 7 Oct 2024 | £720,000 |
| 1 Dec 2020 | £480,000 |
Tormore, High Street, Uckfield TN22 5JX

| Today | See what it's worth now |
| 20 Aug 2024 | £564,000 |
| 1 Apr 2004 | £287,500 |
1 Sucoshe, The Close, Star Lane, Uckfield TN22 5LD

| Today | See what it's worth now |
| 16 Aug 2024 | £592,500 |
No other historical records.
Tickerage Mill, Tickerage Lane, Blackboys TN22 5LU

| Today | See what it's worth now |
| 11 Jul 2024 | £2,650,000 |
No other historical records.
10, The Coachworks, Uckfield TN22 5LF

| Today | See what it's worth now |
| 10 Jul 2024 | £195,000 |
| 4 Oct 2019 | £185,000 |
No other historical records.
The Glade, Gun Road, Uckfield TN22 5HU
| Today | See what it's worth now |
| 28 May 2024 | £895,000 |
No other historical records.
Greenwood, Terminus Road, Uckfield TN22 5LX

| Today | See what it's worth now |
| 21 May 2024 | £640,000 |
| 25 Aug 2016 | £515,000 |
5, Brownings Cottages, Possingworth Lane, Uckfield TN22 5HE

| Today | See what it's worth now |
| 21 May 2024 | £615,000 |
| 25 Aug 2006 | £342,000 |


Source Acknowledgement: © Crown copyright. England and Wales house price data is publicly available information produced by the HM Land Registry.This material was last updated on 9 July 2026. It covers the period from 1 January 1995 to 30 April 2026 and contains property transactions which have been registered during that period. Contains HM Land Registry data © Crown copyright and database right 2026. This data is licensed under the Open Government Licence v3.0.
Disclaimer: Rightmove.co.uk provides this HM Land Registry data "as is". The burden for fitness of the data relies completely with the user and is provided for informational purposes only. No warranty, express or implied, is given relating to the accuracy of content of the HM Land Registry data and Rightmove does not accept any liability for error or omission. If you have found an error with the data or need further information please contact HM Land Registry.
Permitted Use: Viewers of this Information are granted permission to access this Crown copyright material and to download it onto electronic, magnetic, optical or similar storage media provided that such activities are for private research, study or in-house use only. Any other use of the material requires the formal written permission of Land Registry which can be requested from us, and is subject to an additional licence and associated charge.
Rightmove takes no liability for your use of, or reliance on, Rightmove's Instant Valuation due to the limitations of our tracking tool listed here. Use of this tool is taken entirely at your own risk. All rights reserved.