
House Prices in Bonvilston
House prices in Bonvilston have an overall average of £908,550 over the last year.
The majority of properties sold in Bonvilston during the last year were detached properties, selling for an average price of £1,033,643. Semi-detached properties sold for an average of £616,667.
Overall, the historical sold prices in Bonvilston over the last year were 165% up on the previous year and 27% up on the 2021 peak of £717,881.
Properties Sold
Pantyffynonau, Bonvilston CF5 6TQ

| Today | See what it's worth now |
| 17 Nov 2025 | £688,000 |
| 16 Sep 2016 | £450,000 |
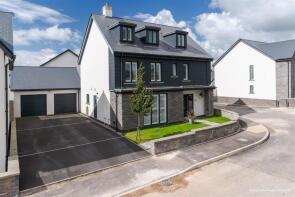
5, Cottrell Gardens, Cardiff CF5 6FU
| Today | See what it's worth now |
| 10 Nov 2025 | £715,000 |
| 25 Apr 2022 | £680,000 |
No other historical records.
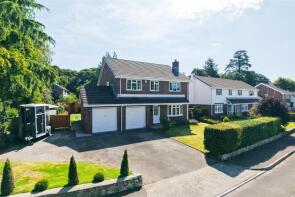
39, Village Farm, Cardiff CF5 6TY
| Today | See what it's worth now |
| 6 Nov 2025 | £670,000 |
| 25 Jun 2004 | £359,000 |
6, Village Farm, Cardiff CF5 6TY

| Today | See what it's worth now |
| 26 Sep 2025 | £777,500 |
| 31 Oct 2017 | £590,000 |
No other historical records.
Pen Y Waun, Lane - Parc-newydd To Cae Garw Via Ty Isha Farm, Cardiff CF5 6TS

| Today | See what it's worth now |
| 15 Aug 2025 | £580,000 |
No other historical records.
Bonvilston Cottage, A48 Bonvilston, Cardiff CF5 6TR

| Today | See what it's worth now |
| 9 Jul 2025 | £1,950,000 |
| 6 May 2021 | £1,665,000 |
Greenway Cottage, Pen Y Waun To Junction A48, Cardiff CF5 6TR

| Today | See what it's worth now |
| 1 Jul 2025 | £775,000 |
| 11 Feb 2000 | £154,500 |
No other historical records.
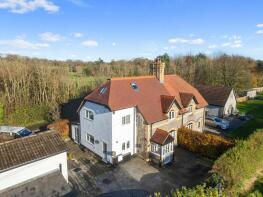
2, Breach Cottages, A48 Bonvilston, Cardiff CF5 6TU
| Today | See what it's worth now |
| 18 Jun 2025 | £570,000 |
| 27 Mar 2020 | £415,000 |
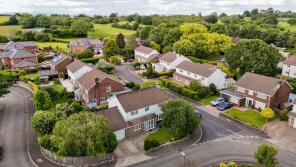
18, Village Farm, Cardiff CF5 6TY
| Today | See what it's worth now |
| 16 May 2025 | £610,000 |
| 28 Feb 2003 | £275,000 |
No other historical records.
Stone Court, A48 Bonvilston, Cardiff CF5 6TR

| Today | See what it's worth now |
| 7 Mar 2025 | £1,750,000 |
| 13 Nov 2003 | £790,000 |
No other historical records.
Haldon Cottage, A48 Bonvilston, Cardiff CF5 6TQ
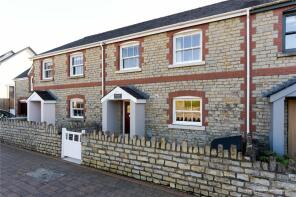
| Today | See what it's worth now |
| 25 Oct 2024 | £440,000 |
| 3 Oct 2022 | £425,000 |
1, Maes-y-ffynon, Cardiff CF5 6TT

| Today | See what it's worth now |
| 1 Oct 2024 | £350,000 |
| 1 Jun 2018 | £255,000 |
No other historical records.
19, Maes-y-ffynon, Bonvilston CF5 6TT
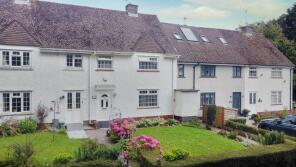
| Today | See what it's worth now |
| 25 Jul 2024 | £260,000 |
No other historical records.
10, Maes-y-ffynon, Bonvilston CF5 6TT
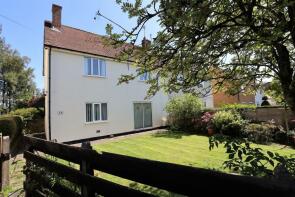
| Today | See what it's worth now |
| 12 Jul 2024 | £320,000 |
No other historical records.
28, Cottrell Gardens, Cardiff CF5 6FU

| Today | See what it's worth now |
| 29 Sep 2023 | £485,000 |
No other historical records.
27, Cottrell Gardens, Cardiff CF5 6FU

| Today | See what it's worth now |
| 28 Sep 2023 | £720,000 |
No other historical records.
The Haven, Lane - Parc-newydd To Cae Garw Via Ty Isha Farm, Cardiff CF5 6TS
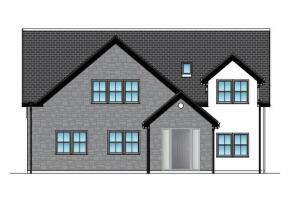
| Today | See what it's worth now |
| 4 Sep 2023 | £420,000 |
| 5 Mar 2021 | £300,000 |
No other historical records.
11, Maes-y-ffynon, Cardiff CF5 6TT

| Today | See what it's worth now |
| 11 Aug 2023 | £405,000 |
| 30 Nov 2020 | £305,000 |
12, Village Farm, Cardiff CF5 6TY

| Today | See what it's worth now |
| 29 Jun 2023 | £715,000 |
| 4 Sep 2002 | £280,000 |
No other historical records.
Pen Bedw, Bonvilston CF5 6TQ
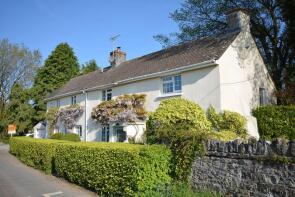
| Today | See what it's worth now |
| 16 Jun 2023 | £790,000 |
| 9 Jun 2014 | £425,000 |
33, Cottrell Gardens, Cardiff CF5 6FU

| Today | See what it's worth now |
| 25 May 2023 | £310,000 |
No other historical records.
34, Cottrell Gardens, Cardiff CF5 6FU
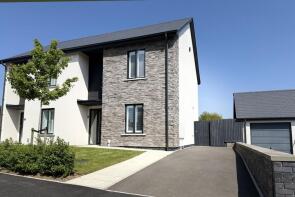
| Today | See what it's worth now |
| 25 May 2023 | £305,000 |
No other historical records.
15, Court Close, Cardiff CF5 6FX

| Today | See what it's worth now |
| 6 Apr 2023 | £660,000 |
No other historical records.
25, Cottrell Gardens, Cardiff CF5 6FU
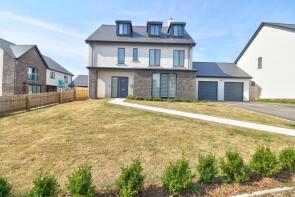
| Today | See what it's worth now |
| 3 Feb 2023 | £750,000 |
| 25 Feb 2021 | £670,000 |
No other historical records.
8, Court Close, Cardiff CF5 6FX

| Today | See what it's worth now |
| 16 Jan 2023 | £715,000 |
No other historical records.
Source Acknowledgement: © Crown copyright. England and Wales house price data is publicly available information produced by the HM Land Registry.This material was last updated on 4 February 2026. It covers the period from 1 January 1995 to 24 December 2025 and contains property transactions which have been registered during that period. Contains HM Land Registry data © Crown copyright and database right 2026. This data is licensed under the Open Government Licence v3.0.
Disclaimer: Rightmove.co.uk provides this HM Land Registry data "as is". The burden for fitness of the data relies completely with the user and is provided for informational purposes only. No warranty, express or implied, is given relating to the accuracy of content of the HM Land Registry data and Rightmove does not accept any liability for error or omission. If you have found an error with the data or need further information please contact HM Land Registry.
Permitted Use: Viewers of this Information are granted permission to access this Crown copyright material and to download it onto electronic, magnetic, optical or similar storage media provided that such activities are for private research, study or in-house use only. Any other use of the material requires the formal written permission of Land Registry which can be requested from us, and is subject to an additional licence and associated charge.
Map data ©OpenStreetMap contributors.
Rightmove takes no liability for your use of, or reliance on, Rightmove's Instant Valuation due to the limitations of our tracking tool listed here. Use of this tool is taken entirely at your own risk. All rights reserved.
