
House Prices in Bridge Hall Industrial Park
House prices in Bridge Hall Industrial Park have an overall average of £186,890 over the last year.
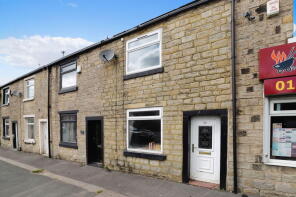
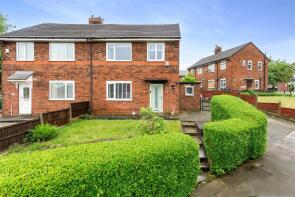
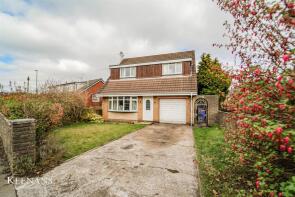
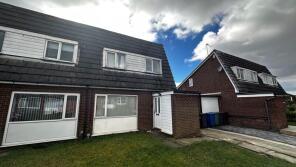
The majority of properties sold in Bridge Hall Industrial Park during the last year were terraced properties, selling for an average price of £154,326. Semi-detached properties sold for an average of £211,104, with detached properties fetching £385,000.
Overall, the historical sold prices in Bridge Hall Industrial Park over the last year were 8% up on the previous year and 17% up on the 2022 peak of £159,857.
Properties Sold
53, South Cross Street, Bury BL9 0RS

| Today | See what it's worth now |
| 17 Dec 2025 | £126,000 |
| 2 Mar 2018 | £78,000 |
5, New Hall Road, Bury BL9 7TQ
| Today | See what it's worth now |
| 28 Nov 2025 | £261,500 |
| 6 Jul 2007 | £186,000 |
No other historical records.
12, Rowan Drive, Bury BL9 7QP
| Today | See what it's worth now |
| 14 Nov 2025 | £158,000 |
| 5 May 2006 | £99,995 |
1a, Bridgefield Drive, Bury BL9 7PE

| Today | See what it's worth now |
| 14 Nov 2025 | £545,000 |
| 11 Sep 2020 | £425,000 |
No other historical records.
5, Openshaw Street, Bury BL9 7EH
| Today | See what it's worth now |
| 7 Nov 2025 | £173,400 |
| 17 Feb 2023 | £65,000 |
1, Gatehouse Court, Bridgefield Drive, Bury BL9 7PD

| Today | See what it's worth now |
| 31 Oct 2025 | £158,000 |
| 13 Sep 2017 | £66,000 |
14, Barrett Court, Bury BL9 7PL

| Today | See what it's worth now |
| 31 Oct 2025 | £170,000 |
| 29 Sep 2016 | £82,000 |
181, Wash Lane, Bury BL9 7DH
| Today | See what it's worth now |
| 31 Oct 2025 | £145,000 |
| 13 Jun 2019 | £90,000 |
47, Deal Street, Bury BL9 7PZ
| Today | See what it's worth now |
| 31 Oct 2025 | £150,000 |
No other historical records.
8, Spruce Avenue, Bury BL9 7QX

| Today | See what it's worth now |
| 23 Oct 2025 | £186,000 |
| 29 Mar 2019 | £130,000 |
1, Benson Street, Bury BL9 7EP

| Today | See what it's worth now |
| 17 Oct 2025 | £98,000 |
| 23 Feb 2007 | £85,000 |
289, Bury Old Road, Bury BL9 7JG
| Today | See what it's worth now |
| 17 Oct 2025 | £202,250 |
| 13 Nov 2020 | £140,000 |
No other historical records.
21, Elm Street, Bury BL9 7DD
| Today | See what it's worth now |
| 10 Oct 2025 | £143,000 |
| 18 Apr 2019 | £62,000 |
15, Pimhole Road, Bury BL9 7EY
| Today | See what it's worth now |
| 10 Oct 2025 | £205,000 |
| 7 May 2020 | £165,000 |
253, Rochdale Old Road, Bury BL9 7SA
| Today | See what it's worth now |
| 9 Oct 2025 | £119,000 |
| 16 Feb 2024 | £112,000 |
No other historical records.
100, Prettywood, Bury New Road, Bury BL9 7HX


| Today | See what it's worth now |
| 19 Sep 2025 | £117,500 |
| 8 Nov 2006 | £90,000 |
6, Primrose Drive, Bury BL9 7SR
| Today | See what it's worth now |
| 15 Sep 2025 | £190,000 |
| 11 Sep 2020 | £145,000 |
No other historical records.
20, Tinline Street, Bury BL9 7HG

| Today | See what it's worth now |
| 12 Sep 2025 | £133,000 |
| 11 Mar 2019 | £85,000 |
271, Bury Old Road, Bury BL9 7JB

| Today | See what it's worth now |
| 10 Sep 2025 | £222,000 |
| 18 Jun 2021 | £185,000 |
3, Smethurst Hall Road, Bury BL9 7TP
| Today | See what it's worth now |
| 22 Aug 2025 | £260,000 |
No other historical records.
17, Chestnut Avenue, Bury BL9 7QW

| Today | See what it's worth now |
| 22 Aug 2025 | £150,000 |
| 27 Jul 2007 | £86,500 |
38, Rectory Lane, Bury BL9 7TA
| Today | See what it's worth now |
| 15 Aug 2025 | £156,000 |
No other historical records.
72, Oxford Mews, Oxford Street, Bury BL9 7EL
| Today | See what it's worth now |
| 15 Aug 2025 | £188,000 |
| 16 Nov 2012 | £85,500 |
No other historical records.
557, Rochdale Old Road, Bury BL9 7TE
| Today | See what it's worth now |
| 4 Aug 2025 | £230,000 |
| 20 Apr 2018 | £125,000 |
No other historical records.
16, Andrew Street, Bury BL9 7HD
| Today | See what it's worth now |
| 31 Jul 2025 | £140,000 |
| 20 Aug 2004 | £51,500 |
No other historical records.
Source Acknowledgement: © Crown copyright. England and Wales house price data is publicly available information produced by the HM Land Registry.This material was last updated on 4 February 2026. It covers the period from 1 January 1995 to 24 December 2025 and contains property transactions which have been registered during that period. Contains HM Land Registry data © Crown copyright and database right 2026. This data is licensed under the Open Government Licence v3.0.
Disclaimer: Rightmove.co.uk provides this HM Land Registry data "as is". The burden for fitness of the data relies completely with the user and is provided for informational purposes only. No warranty, express or implied, is given relating to the accuracy of content of the HM Land Registry data and Rightmove does not accept any liability for error or omission. If you have found an error with the data or need further information please contact HM Land Registry.
Permitted Use: Viewers of this Information are granted permission to access this Crown copyright material and to download it onto electronic, magnetic, optical or similar storage media provided that such activities are for private research, study or in-house use only. Any other use of the material requires the formal written permission of Land Registry which can be requested from us, and is subject to an additional licence and associated charge.
Map data ©OpenStreetMap contributors.
Rightmove takes no liability for your use of, or reliance on, Rightmove's Instant Valuation due to the limitations of our tracking tool listed here. Use of this tool is taken entirely at your own risk. All rights reserved.