
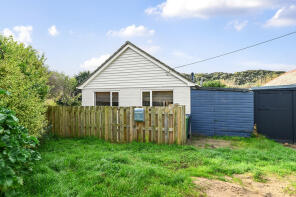
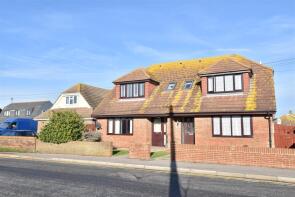
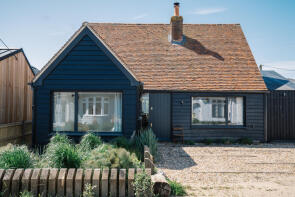
House Prices in Camber
House prices in Camber have an overall average of £311,735 over the last year.
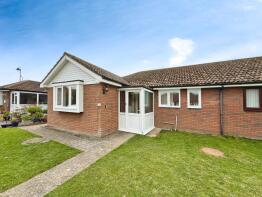
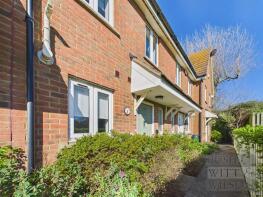
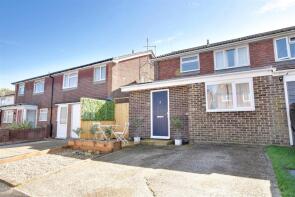
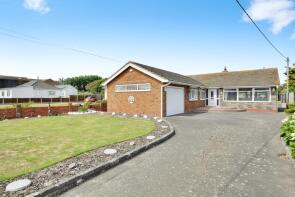
The majority of properties sold in Camber during the last year were detached properties, selling for an average price of £437,143. Terraced properties sold for an average of £230,250, with semi-detached properties fetching £278,500.
Overall, the historical sold prices in Camber over the last year were 34% down on the previous year and 19% down on the 2021 peak of £382,957.
Properties Sold
2, Scotts Acre, Camber TN31 7RQ
| Today | See what it's worth now |
| 24 Mar 2026 | £288,000 |
No other historical records.
5, Sea Holly Walk, Rye TN31 7UW
| Today | See what it's worth now |
| 18 Mar 2026 | £217,000 |
| 28 Mar 2014 | £192,000 |
No other historical records.
57, Denham Way, Rye TN31 7XR
| Today | See what it's worth now |
| 16 Mar 2026 | £267,500 |
| 4 May 2021 | £195,000 |
77 Tresco, Lydd Road, Rye TN31 7RS
| Today | See what it's worth now |
| 30 Jan 2026 | £415,000 |
| 24 Jun 2015 | £280,000 |
112, Lydd Road, Camber TN31 7RS
| Today | See what it's worth now |
| 9 Jan 2026 | £310,000 |
No other historical records.
27, Marsh Way, Rye TN31 7WQ
| Today | See what it's worth now |
| 19 Dec 2025 | £215,000 |
| 24 Apr 2014 | £156,000 |
74 Creg Ny Baa, Lydd Road, Rye TN31 7RS
| Today | See what it's worth now |
| 19 Dec 2025 | £735,000 |
| 26 Feb 2021 | £685,000 |
26, Pelwood Road, Rye TN31 7RU
| Today | See what it's worth now |
| 16 Dec 2025 | £235,000 |
| 8 Jun 2012 | £135,000 |
No other historical records.
18 Oakfield, Lydd Road, Rye TN31 7RJ
| Today | See what it's worth now |
| 16 Dec 2025 | £405,000 |
| 12 Dec 2002 | £145,000 |
No other historical records.
5, Skylark Lane, Rye TN31 7SP
| Today | See what it's worth now |
| 10 Dec 2025 | £280,000 |
| 14 Jan 2023 | £340,000 |
7, Saunders Way, Rye TN31 7RW

| Today | See what it's worth now |
| 4 Dec 2025 | £130,000 |
| 7 Jan 2019 | £80,000 |
36, Whitesand Drive, Rye TN31 7SJ
| Today | See what it's worth now |
| 20 Oct 2025 | £207,000 |
| 3 Oct 2016 | £220,000 |
Greengates, Wall Farm Lane, Rye TN31 7SE
| Today | See what it's worth now |
| 29 Sep 2025 | £470,000 |
No other historical records.
Ground Floor Flat, 59 Fernlea Court, Lydd Road, Rye TN31 7RS
| Today | See what it's worth now |
| 21 Aug 2025 | £138,000 |
| 18 Feb 2015 | £100,000 |
13, Marchants Drive, Rye TN31 7RF
| Today | See what it's worth now |
| 28 Jul 2025 | £262,000 |
| 22 Feb 2018 | £140,000 |
10, Scotts Acre, Rye TN31 7RQ
| Today | See what it's worth now |
| 18 Jul 2025 | £305,000 |
| 9 Nov 2000 | £105,000 |
No other historical records.
Dereta, First Avenue, Camber TN31 7FQ
| Today | See what it's worth now |
| 16 Jul 2025 | £420,000 |
| 27 May 2011 | £160,000 |
129, Lydd Road, Rye TN31 7RS
| Today | See what it's worth now |
| 23 May 2025 | £315,000 |
| 2 Feb 2022 | £320,000 |
2, Baker Way, Rye TN31 7SN
| Today | See what it's worth now |
| 23 May 2025 | £237,500 |
| 7 Dec 2017 | £199,000 |
8, Royal William Square, Rye TN31 7RX
| Today | See what it's worth now |
| 22 May 2025 | £425,000 |
| 19 Dec 2022 | £436,000 |
26, Marsh Way, Rye TN31 7WQ
| Today | See what it's worth now |
| 15 May 2025 | £182,500 |
| 30 Mar 2016 | £150,000 |
The Dunes, First Avenue, Rye TN31 7FQ
| Today | See what it's worth now |
| 1 Apr 2025 | £592,500 |
| 9 Oct 2020 | £460,000 |
Katinka, Sea Road, Rye TN31 7RR
| Today | See what it's worth now |
| 31 Mar 2025 | £335,000 |
| 4 Sep 2018 | £234,950 |
Source Acknowledgement: © Crown copyright. England and Wales house price data is publicly available information produced by the HM Land Registry.This material was last updated on 9 July 2026. It covers the period from 1 January 1995 to 30 April 2026 and contains property transactions which have been registered during that period. Contains HM Land Registry data © Crown copyright and database right 2026. This data is licensed under the Open Government Licence v3.0.
Disclaimer: Rightmove.co.uk provides this HM Land Registry data "as is". The burden for fitness of the data relies completely with the user and is provided for informational purposes only. No warranty, express or implied, is given relating to the accuracy of content of the HM Land Registry data and Rightmove does not accept any liability for error or omission. If you have found an error with the data or need further information please contact HM Land Registry.
Permitted Use: Viewers of this Information are granted permission to access this Crown copyright material and to download it onto electronic, magnetic, optical or similar storage media provided that such activities are for private research, study or in-house use only. Any other use of the material requires the formal written permission of Land Registry which can be requested from us, and is subject to an additional licence and associated charge.
Rightmove takes no liability for your use of, or reliance on, Rightmove's Instant Valuation due to the limitations of our tracking tool listed here. Use of this tool is taken entirely at your own risk. All rights reserved.