
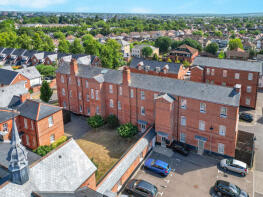
House Prices in Chelmsford
House prices in Chelmsford have an overall average of £414,799 over the last year.
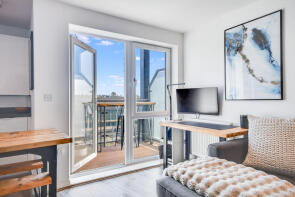
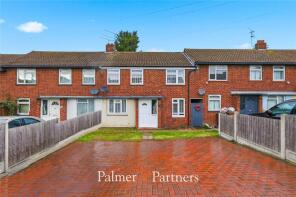
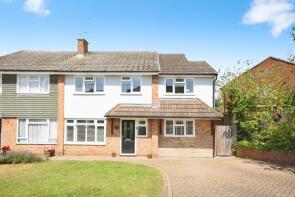
The majority of properties sold in Chelmsford during the last year were semi-detached properties, selling for an average price of £457,013. Terraced properties sold for an average of £370,216, with flats fetching £222,499.
Overall, the historical sold prices in Chelmsford over the last year were similar to the previous year and similar to the 2022 peak of £414,578.
Properties Sold
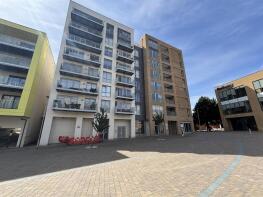
Flat 51, 3, Cunard Square, Chelmsford CM1 1AU
| Today | See what it's worth now |
| 30 Apr 2026 | £325,000 |
| 12 Oct 2018 | £352,500 |
No other historical records.
4, Elm Road, Chelmsford CM2 0JL
| Today | See what it's worth now |
| 27 Apr 2026 | £420,000 |
| 6 Mar 2019 | £328,000 |
No other historical records.
203, Meadgate Avenue, Great Baddow, Chelmsford CM2 7NJ
| Today | See what it's worth now |
| 24 Apr 2026 | £320,000 |
| 14 Oct 2013 | £210,000 |
5, Trotwood Close, Chelmsford CM1 4UZ

| Today | See what it's worth now |
| 22 Apr 2026 | £460,000 |
| 16 Jan 2015 | £325,000 |
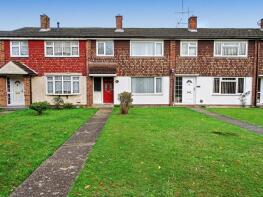
17, Wickfield Ash, Chelmsford CM1 4UT
| Today | See what it's worth now |
| 22 Apr 2026 | £405,000 |
| 30 Sep 2019 | £335,000 |
No other historical records.
29, Eglinton Drive, Springfield, Chelmsford CM2 6WT
| Today | See what it's worth now |
| 22 Apr 2026 | £476,000 |
| 1 Aug 2022 | £460,000 |
29, Martingale Drive, Springfield, Chelmsford CM1 6FN
| Today | See what it's worth now |
| 17 Apr 2026 | £488,000 |
| 18 May 2015 | £330,000 |
No other historical records.
108, Bodmin Road, Chelmsford CM1 6LL
| Today | See what it's worth now |
| 17 Apr 2026 | £450,000 |
| 24 Oct 2014 | £319,000 |
158, Beeches Road, Chelmsford CM1 2RZ

| Today | See what it's worth now |
| 17 Apr 2026 | £450,000 |
| 8 Jul 2016 | £325,500 |
No other historical records.
61, Earlsfield Drive, Springfield, Chelmsford CM2 6SX
| Today | See what it's worth now |
| 17 Apr 2026 | £212,000 |
| 9 Oct 2015 | £182,000 |
16, Mary Munnion Quarter, Chelmsford CM2 9FT
| Today | See what it's worth now |
| 16 Apr 2026 | £285,000 |
| 26 Mar 2021 | £300,000 |
24, 90 Gemini House, New London Road, Chelmsford CM2 0PD

| Today | See what it's worth now |
| 13 Apr 2026 | £227,000 |
| 20 Sep 2022 | £225,000 |
8, Goldlay Gardens, Chelmsford CM2 0EN

| Today | See what it's worth now |
| 12 Apr 2026 | £320,000 |
| 13 Jan 2017 | £399,995 |
27, Wickfield Ash, Chelmsford CM1 4UT

| Today | See what it's worth now |
| 10 Apr 2026 | £520,000 |
| 23 Nov 2006 | £290,000 |
No other historical records.
Flat, 165, Wharf Road, Chelmsford CM2 6FS
| Today | See what it's worth now |
| 10 Apr 2026 | £250,000 |
| 17 Sep 2020 | £247,500 |
47, Mendip Road, Chelmsford CM1 2HN
| Today | See what it's worth now |
| 10 Apr 2026 | £307,500 |
| 26 Jul 2019 | £265,000 |
37, Burnell Gate, Springfield, Chelmsford CM1 6ED

| Today | See what it's worth now |
| 10 Apr 2026 | £589,250 |
| 19 Mar 2004 | £234,000 |
No other historical records.
52, Chichester Drive, Chelmsford CM1 7RY
| Today | See what it's worth now |
| 10 Apr 2026 | £570,000 |
| 6 Aug 2009 | £220,000 |
19, Burnell Gate, Springfield, Chelmsford CM1 6ED
| Today | See what it's worth now |
| 10 Apr 2026 | £760,000 |
| 6 Aug 2021 | £695,000 |
7, Upper Bridge Road, Chelmsford CM2 0RT

| Today | See what it's worth now |
| 10 Apr 2026 | £427,500 |
No other historical records.
44, Godfreys Mews, Chelmsford CM2 0XE
| Today | See what it's worth now |
| 10 Apr 2026 | £170,000 |
| 28 Jul 2023 | £180,000 |
9, North Avenue, Chelmsford CM1 2AL
| Today | See what it's worth now |
| 9 Apr 2026 | £420,000 |
| 25 Jan 2021 | £335,000 |
4, Regency Close, Chelmsford CM2 6DU
| Today | See what it's worth now |
| 9 Apr 2026 | £452,000 |
| 27 Sep 2024 | £430,000 |
No other historical records.
Source Acknowledgement: © Crown copyright. England and Wales house price data is publicly available information produced by the HM Land Registry.This material was last updated on 9 July 2026. It covers the period from 1 January 1995 to 30 April 2026 and contains property transactions which have been registered during that period. Contains HM Land Registry data © Crown copyright and database right 2026. This data is licensed under the Open Government Licence v3.0.
Disclaimer: Rightmove.co.uk provides this HM Land Registry data "as is". The burden for fitness of the data relies completely with the user and is provided for informational purposes only. No warranty, express or implied, is given relating to the accuracy of content of the HM Land Registry data and Rightmove does not accept any liability for error or omission. If you have found an error with the data or need further information please contact HM Land Registry.
Permitted Use: Viewers of this Information are granted permission to access this Crown copyright material and to download it onto electronic, magnetic, optical or similar storage media provided that such activities are for private research, study or in-house use only. Any other use of the material requires the formal written permission of Land Registry which can be requested from us, and is subject to an additional licence and associated charge.
Rightmove takes no liability for your use of, or reliance on, Rightmove's Instant Valuation due to the limitations of our tracking tool listed here. Use of this tool is taken entirely at your own risk. All rights reserved.