
House Prices in Claypole
House prices in Claypole have an overall average of £359,009 over the last year.
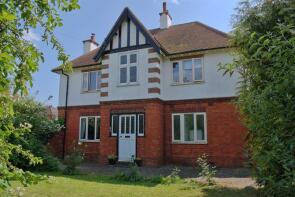
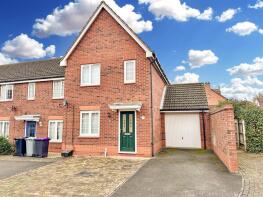
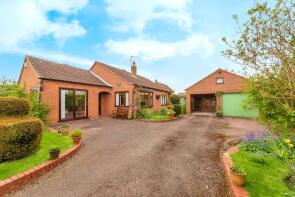
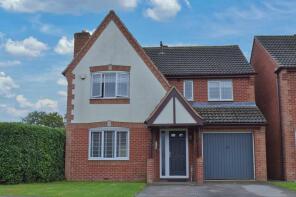
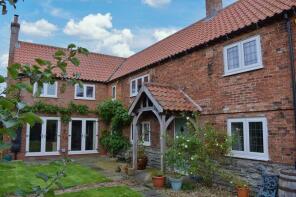
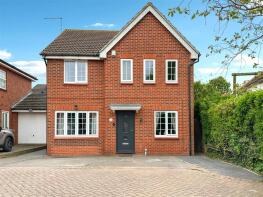
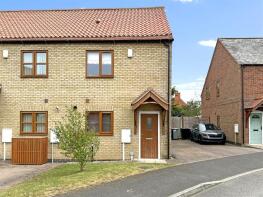
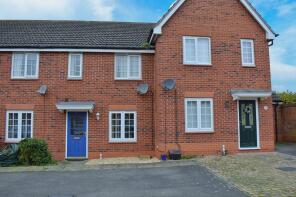
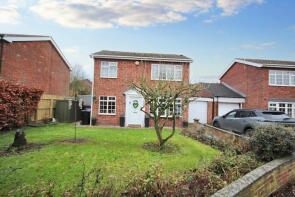
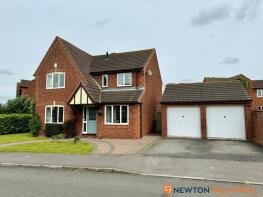
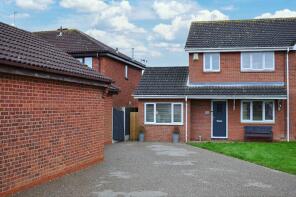
The majority of properties sold in Claypole during the last year were detached properties, selling for an average price of £427,598. Terraced properties sold for an average of £235,750, with semi-detached properties fetching £249,000.
Overall, the historical sold prices in Claypole over the last year were 35% up on the previous year and 7% up on the 2021 peak of £336,543.
Properties Sold
1, Swallow Drive, Newark NG23 5FG
| Today | See what it's worth now |
| 2 Apr 2026 | £365,000 |
| 4 Dec 2020 | £263,000 |
38, Barnby Lane, Newark NG23 5BD
| Today | See what it's worth now |
| 2 Apr 2026 | £235,000 |
| 16 Dec 2016 | £163,000 |
38 Rose Cottage, Main Street, Newark NG23 5BA
| Today | See what it's worth now |
| 27 Mar 2026 | £367,000 |
| 28 Oct 2014 | £240,000 |
Acorn House, Back Lane, Claypole NG23 5AA
| Today | See what it's worth now |
| 12 Mar 2026 | £700,000 |
| 18 May 2023 | £650,000 |
Cleveland Farm, Main Street, Claypole NG23 5BA
| Today | See what it's worth now |
| 6 Feb 2026 | £400,000 |
No other historical records.
20, Wickliffe Park, Newark NG23 5AE
| Today | See what it's worth now |
| 3 Feb 2026 | £173,000 |
| 25 Nov 2015 | £120,000 |
Fen Barn, Main Street, Claypole NG23 5BA
| Today | See what it's worth now |
| 16 Dec 2025 | £880,175 |
No other historical records.
59, Wickliffe Park, Newark NG23 5AE
| Today | See what it's worth now |
| 12 Dec 2025 | £230,000 |
| 30 Jun 2004 | £128,950 |
No other historical records.
1 The Lilacs, Back Lane, Newark NG23 5AA
| Today | See what it's worth now |
| 9 Dec 2025 | £290,000 |
| 10 Nov 2006 | £192,500 |
No other historical records.
51, Moore Close, Newark NG23 5AU
| Today | See what it's worth now |
| 1 Dec 2025 | £312,000 |
| 7 Nov 2024 | £310,000 |
10, Revill Close, Newark NG23 5FJ
| Today | See what it's worth now |
| 31 Oct 2025 | £287,000 |
| 30 Mar 2020 | £225,000 |
3 Rowan Cottage, Church Meadow, Newark NG23 5AR

| Today | See what it's worth now |
| 31 Oct 2025 | £235,000 |
| 20 May 2021 | £180,000 |
19, Moore Close, Newark NG23 5AU
| Today | See what it's worth now |
| 24 Oct 2025 | £170,000 |
| 24 Nov 2023 | £170,000 |
5 Fen Cottage, Welfen Lane, Newark NG23 5AL
| Today | See what it's worth now |
| 19 Sep 2025 | £277,000 |
| 19 May 2006 | £162,500 |
No other historical records.
10, Swallow Drive, Newark NG23 5FG
| Today | See what it's worth now |
| 12 Sep 2025 | £320,000 |
| 29 Aug 2014 | £204,000 |
27 Orchard Farmhouse, Back Lane, Newark NG23 5AA
| Today | See what it's worth now |
| 26 Aug 2025 | £560,000 |
| 1 Oct 2012 | £250,000 |
No other historical records.
10, Wickliffe Park, Newark NG23 5AE
| Today | See what it's worth now |
| 22 Aug 2025 | £385,000 |
| 13 Dec 2019 | £240,000 |
3, Evans Close, Newark NG23 5GH
| Today | See what it's worth now |
| 1 Aug 2025 | £435,000 |
| 31 Jan 2014 | £249,950 |
No other historical records.
6, Peacocks Launde, Newark NG23 5FS
| Today | See what it's worth now |
| 31 Jul 2025 | £200,000 |
| 18 Sep 2020 | £155,000 |
57, Wickliffe Park, Newark NG23 5AE
| Today | See what it's worth now |
| 2 May 2025 | £163,000 |
| 29 Mar 2021 | £145,000 |
10, Tinsley Close, Newark NG23 5BS
| Today | See what it's worth now |
| 31 Mar 2025 | £240,000 |
| 14 Dec 2007 | £175,000 |
3, Swallow Drive, Newark NG23 5FG
| Today | See what it's worth now |
| 21 Mar 2025 | £370,000 |
| 21 Sep 2007 | £232,000 |
39, Moore Close, Newark NG23 5AU
| Today | See what it's worth now |
| 14 Mar 2025 | £235,000 |
| 15 Jul 2020 | £177,000 |

Source Acknowledgement: © Crown copyright. England and Wales house price data is publicly available information produced by the HM Land Registry.This material was last updated on 9 July 2026. It covers the period from 1 January 1995 to 30 April 2026 and contains property transactions which have been registered during that period. Contains HM Land Registry data © Crown copyright and database right 2026. This data is licensed under the Open Government Licence v3.0.
Disclaimer: Rightmove.co.uk provides this HM Land Registry data "as is". The burden for fitness of the data relies completely with the user and is provided for informational purposes only. No warranty, express or implied, is given relating to the accuracy of content of the HM Land Registry data and Rightmove does not accept any liability for error or omission. If you have found an error with the data or need further information please contact HM Land Registry.
Permitted Use: Viewers of this Information are granted permission to access this Crown copyright material and to download it onto electronic, magnetic, optical or similar storage media provided that such activities are for private research, study or in-house use only. Any other use of the material requires the formal written permission of Land Registry which can be requested from us, and is subject to an additional licence and associated charge.
Rightmove takes no liability for your use of, or reliance on, Rightmove's Instant Valuation due to the limitations of our tracking tool listed here. Use of this tool is taken entirely at your own risk. All rights reserved.