
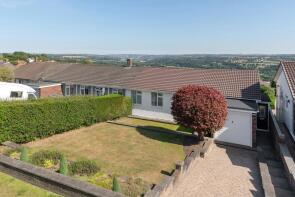
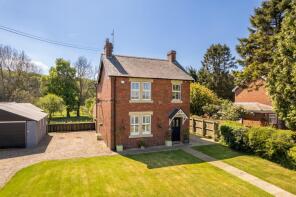
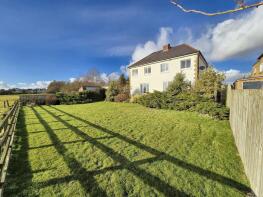
House Prices in Close House
House prices in Close House have an overall average of £385,051 over the last year.
The majority of properties sold in Close House during the last year were detached properties, selling for an average price of £508,369. Semi-detached properties sold for an average of £340,625, with terraced properties fetching £283,333.
Overall, the historical sold prices in Close House over the last year were 14% up on the previous year and 5% down on the 2021 peak of £405,803.
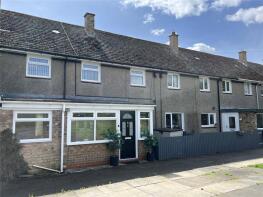
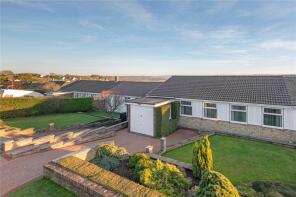
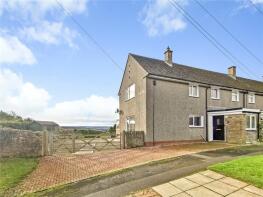
Properties Sold
12a, Calvus Drive, Newcastle Upon Tyne NE15 0DZ

| Today | See what it's worth now |
| 17 Feb 2026 | £128,000 |
| 4 May 2007 | £122,000 |
23, Aquila Drive, Newcastle Upon Tyne NE15 0BS
| Today | See what it's worth now |
| 6 Feb 2026 | £335,000 |
| 29 Jul 2004 | £180,000 |
No other historical records.
2, Hill Croft, Newcastle Upon Tyne NE15 0NW
| Today | See what it's worth now |
| 5 Dec 2025 | £240,000 |
| 16 Dec 2019 | £170,000 |
No other historical records.
25, Aquila Drive, Newcastle Upon Tyne NE15 0BS
| Today | See what it's worth now |
| 5 Nov 2025 | £340,000 |
| 12 Dec 2002 | £150,000 |
1, Hill Croft, Newcastle Upon Tyne NE15 0NW
| Today | See what it's worth now |
| 31 Oct 2025 | £275,000 |
| 26 Jul 2019 | £82,000 |
No other historical records.
45, Military Road, Newcastle Upon Tyne NE15 0HA
| Today | See what it's worth now |
| 24 Oct 2025 | £500,000 |
| 26 Mar 2021 | £414,000 |
4, Spital Villas, Horsley NE15 0LY
| Today | See what it's worth now |
| 3 Oct 2025 | £532,716 |
No other historical records.
23, Hexham Road, Newcastle Upon Tyne NE15 0BG


| Today | See what it's worth now |
| 29 Aug 2025 | £475,000 |
| 7 Sep 1995 | £131,000 |
No other historical records.
19, Trajan Walk, Newcastle Upon Tyne NE15 0BL
| Today | See what it's worth now |
| 8 Aug 2025 | £275,000 |
| 5 Oct 2007 | £212,000 |
Woodside, Horsley NE15 0NU

| Today | See what it's worth now |
| 18 Jul 2025 | £125,000 |
No other historical records.
40 The Wynding, Heddon Banks, Newcastle Upon Tyne NE15 0BU
| Today | See what it's worth now |
| 28 May 2025 | £795,000 |
| 18 Jan 2018 | £565,000 |
No other historical records.
1, Antonine Walk, Newcastle Upon Tyne NE15 0EE

| Today | See what it's worth now |
| 28 May 2025 | £272,500 |
No other historical records.
28, Heddon Banks, Newcastle Upon Tyne NE15 0BU

| Today | See what it's worth now |
| 23 Apr 2025 | £702,500 |
| 16 Nov 2021 | £630,000 |
1, Station Road, Newcastle Upon Tyne NE15 0DY
| Today | See what it's worth now |
| 9 Apr 2025 | £395,000 |
| 22 Oct 2021 | £260,000 |
No other historical records.
3 The Forge, South East Farm, Newcastle Upon Tyne NE15 0NT

| Today | See what it's worth now |
| 28 Mar 2025 | £420,000 |
| 9 Feb 2024 | £395,000 |
29, Killiebrigs, Heddon-on-the-wall NE15 0DD
| Today | See what it's worth now |
| 20 Mar 2025 | £412,500 |
No other historical records.
Holmside, Birk Road, Newcastle Upon Tyne NE15 0HF

| Today | See what it's worth now |
| 28 Feb 2025 | £510,000 |
| 1 Mar 2022 | £520,000 |
26, Calvus Drive, Heddon-on-the-wall NE15 0DZ

| Today | See what it's worth now |
| 26 Feb 2025 | £250,000 |
No other historical records.
3, Crown And Anchor Cottages, Newcastle Upon Tyne NE15 0NG
| Today | See what it's worth now |
| 24 Feb 2025 | £250,000 |
| 11 Jul 2019 | £222,000 |
3, The Terrace, Harlow Hill NE15 0QE

| Today | See what it's worth now |
| 21 Feb 2025 | £175,000 |
No other historical records.
29, Valerian Avenue, Newcastle Upon Tyne NE15 0EA

| Today | See what it's worth now |
| 10 Jan 2025 | £365,000 |
| 28 Oct 2002 | £125,000 |
No other historical records.
14, Station Road, Newcastle Upon Tyne NE15 0DY
| Today | See what it's worth now |
| 12 Dec 2024 | £475,000 |
| 29 Jun 2007 | £430,000 |
No other historical records.
19, Aquila Drive, Newcastle Upon Tyne NE15 0BS

| Today | See what it's worth now |
| 12 Dec 2024 | £360,000 |
| 29 Mar 2021 | £245,000 |
No other historical records.
16, Antonine Walk, Heddon-on-the-wall NE15 0EE

| Today | See what it's worth now |
| 29 Nov 2024 | £205,000 |
No other historical records.
Houghton School House, Hexham Road By Houghton Farms, Newcastle Upon Tyne NE15 0EZ
| Today | See what it's worth now |
| 27 Nov 2024 | £820,000 |
| 20 Mar 2008 | £530,000 |
Source Acknowledgement: © Crown copyright. England and Wales house price data is publicly available information produced by the HM Land Registry.This material was last updated on 9 April 2026. It covers the period from 1 January 1995 to 27 February 2026 and contains property transactions which have been registered during that period. Contains HM Land Registry data © Crown copyright and database right 2026. This data is licensed under the Open Government Licence v3.0.
Disclaimer: Rightmove.co.uk provides this HM Land Registry data "as is". The burden for fitness of the data relies completely with the user and is provided for informational purposes only. No warranty, express or implied, is given relating to the accuracy of content of the HM Land Registry data and Rightmove does not accept any liability for error or omission. If you have found an error with the data or need further information please contact HM Land Registry.
Permitted Use: Viewers of this Information are granted permission to access this Crown copyright material and to download it onto electronic, magnetic, optical or similar storage media provided that such activities are for private research, study or in-house use only. Any other use of the material requires the formal written permission of Land Registry which can be requested from us, and is subject to an additional licence and associated charge.
Map data ©OpenStreetMap contributors.
Rightmove takes no liability for your use of, or reliance on, Rightmove's Instant Valuation due to the limitations of our tracking tool listed here. Use of this tool is taken entirely at your own risk. All rights reserved.