House Prices in Chapel Lane, West Bergholt, Colchester, Essex, CO6
House prices in Chapel Lane have an overall average of £531,667 over the last year.
Overall, the historical sold prices in Chapel Lane over the last year were 32% down on the 2022 peak of £780,000.
Properties Sold
Micina, Chapel Lane, West Bergholt CO6 3EF
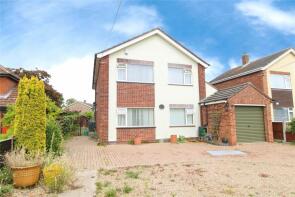
| Today | See what it's worth now |
| 6 Dec 2024 | £425,000 |
No other historical records.
Tregenna, Chapel Lane, Colchester CO6 3EF
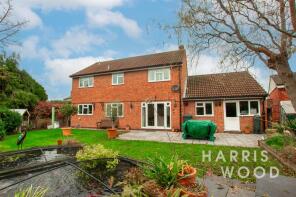
| Today | See what it's worth now |
| 13 Nov 2024 | £545,000 |
| 22 Apr 2004 | £290,000 |
No other historical records.
1, Laborne Place, Chapel Lane, Colchester CO6 3EF

| Today | See what it's worth now |
| 28 Oct 2024 | £625,000 |
| 11 May 2018 | £585,000 |
Orchard Cottage, Chapel Lane, Colchester CO6 3EF
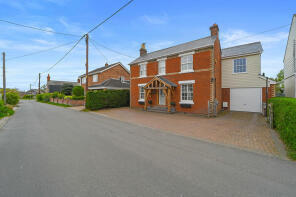
| Today | See what it's worth now |
| 29 Sep 2022 | £780,000 |
| 14 Dec 2009 | £437,000 |
St Andrews, Chapel Lane, Colchester CO6 3EG

| Today | See what it's worth now |
| 12 Apr 2021 | £565,000 |
| 9 Dec 1999 | £143,000 |
Topaz, Chapel Lane, Colchester CO6 3EG

| Today | See what it's worth now |
| 29 Mar 2021 | £950,000 |
| 7 Nov 2002 | £337,000 |
No other historical records.
Dale Vera, Chapel Lane, Colchester CO6 3EG
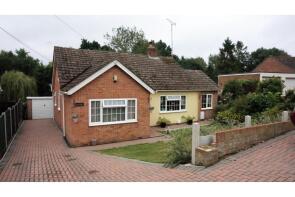
| Today | See what it's worth now |
| 28 Jan 2021 | £488,000 |
| 4 Sep 1998 | £124,000 |
No other historical records.
Firs Croft, Chapel Lane, Colchester CO6 3EG
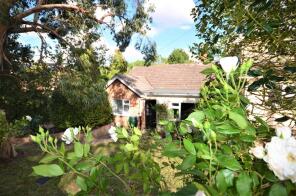
| Today | See what it's worth now |
| 4 Dec 2020 | £320,000 |
| 30 Jul 1996 | £78,500 |
No other historical records.
1, Sunkist Cottages, Chapel Lane, Colchester CO6 3EG
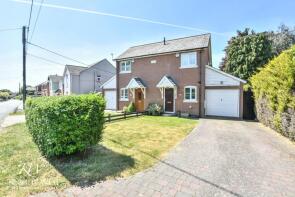
| Today | See what it's worth now |
| 28 Aug 2020 | £275,000 |
| 29 May 2014 | £195,600 |
No other historical records.
Rivendale, Chapel Lane, Colchester CO6 3EG

| Today | See what it's worth now |
| 24 Feb 2020 | �£557,000 |
| 21 Oct 2010 | £263,000 |
No other historical records.
Twain, Chapel Lane, Colchester CO6 3EF

| Today | See what it's worth now |
| 13 Dec 2019 | £316,000 |
| 26 Mar 1999 | £129,950 |
No other historical records.
Ridgeway, Chapel Lane, Colchester CO6 3EG
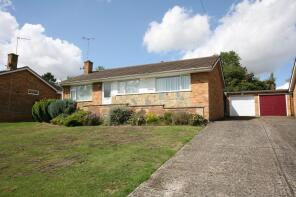
| Today | See what it's worth now |
| 21 Mar 2018 | £208,000 |
No other historical records.
Redthorne, Chapel Lane, Colchester CO6 3EF
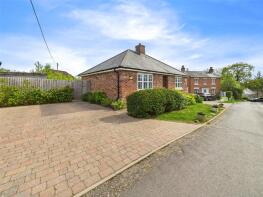
| Today | See what it's worth now |
| 22 Sep 2017 | £395,000 |
No other historical records.
Lealands, Chapel Lane, Colchester CO6 3EF
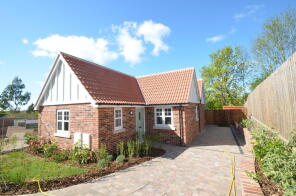
| Today | See what it's worth now |
| 9 Aug 2017 | £397,000 |
No other historical records.
Fairview, Chapel Lane, Colchester CO6 3EF
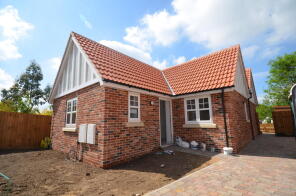
| Today | See what it's worth now |
| 27 Jul 2017 | £396,000 |
No other historical records.
Plean Cottage, Chapel Lane, Colchester CO6 3EF
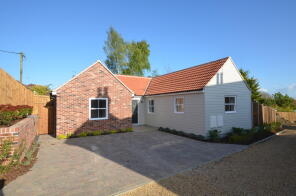
| Today | See what it's worth now |
| 10 Jul 2017 | £450,000 |
No other historical records.
Lynmouth, Chapel Lane, Colchester CO6 3EF
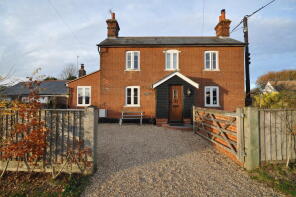
| Today | See what it's worth now |
| 22 May 2017 | £350,000 |
| 7 Feb 2007 | £228,000 |
Lythgo, Chapel Lane, Colchester CO6 3EF
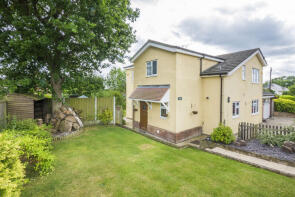
| Today | See what it's worth now |
| 22 Jan 2016 | £475,000 |
No other historical records.
Homecroft, Chapel Lane, Colchester CO6 3EF
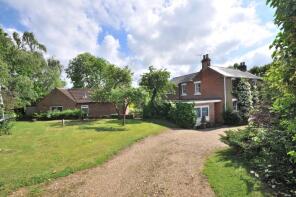
| Today | See what it's worth now |
| 5 Jun 2015 | £525,000 |
No other historical records.
Cranham, Chapel Lane, Colchester CO6 3EG

| Today | See what it's worth now |
| 9 Jan 2015 | £388,000 |
| 22 Oct 2003 | £280,000 |
Caroline, Chapel Lane, Colchester CO6 3EG
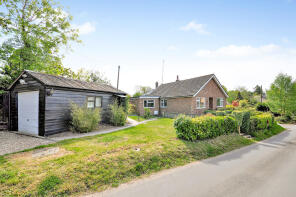
| Today | See what it's worth now |
| 6 Mar 2014 | £210,000 |
No other historical records.
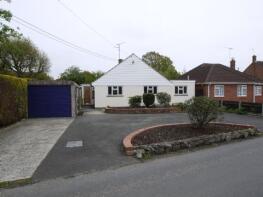
Budleigh, Chapel Lane, Colchester CO6 3EF
| Today | See what it's worth now |
| 13 Sep 2013 | £310,000 |
| 28 Jan 2013 | £227,000 |
No other historical records.
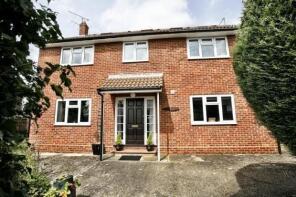
Tall Pines, Chapel Lane, Colchester CO6 3EF
| Today | See what it's worth now |
| 19 Aug 2013 | £350,000 |
No other historical records.
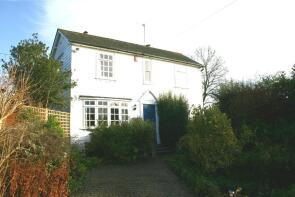
Timbers, Chapel Lane, Colchester CO6 3EG
| Today | See what it's worth now |
| 26 Jul 2013 | £275,000 |
| 24 Jan 1997 | £102,000 |
1 Redwood, Chapel Lane, Colchester CO6 3EF

| Today | See what it's worth now |
| 10 Nov 2010 | £442,500 |
No other historical records.
Find out how much your property is worth
The following agents can provide you with a free, no-obligation valuation. Simply select the ones you'd like to hear from.
Sponsored
All featured agents have paid a fee to promote their valuation expertise.

Nicholas Percival
Colchester

Chewton Rose
Colchester

Oakheart Property
Sudbury, covering Halstead & The Colnes

Fenn Wright
Colchester

Michaels Property Consultants Ltd
Colchester

Palmer & Partners
Colchester & Coast
Get ready with a Mortgage in Principle
- Personalised result in just 20 minutes
- Find out how much you can borrow
- Get viewings faster with agents
- No impact on your credit score
What's your property worth?
Source Acknowledgement: © Crown copyright. England and Wales house price data is publicly available information produced by the HM Land Registry.This material was last updated on 16 July 2025. It covers the period from 1 January 1995 to 30 May 2025 and contains property transactions which have been registered during that period. Contains HM Land Registry data © Crown copyright and database right 2025. This data is licensed under the Open Government Licence v3.0.
Disclaimer: Rightmove.co.uk provides this HM Land Registry data "as is". The burden for fitness of the data relies completely with the user and is provided for informational purposes only. No warranty, express or implied, is given relating to the accuracy of content of the HM Land Registry data and Rightmove does not accept any liability for error or omission. If you have found an error with the data or need further information please contact HM Land Registry.
Permitted Use: Viewers of this Information are granted permission to access this Crown copyright material and to download it onto electronic, magnetic, optical or similar storage media provided that such activities are for private research, study or in-house use only. Any other use of the material requires the formal written permission of Land Registry which can be requested from us, and is subject to an additional licence and associated charge.
Data on planning applications, home extensions and build costs is provided by Resi.co.uk. Planning data is calculated using the last 2 years of residential applications within the selected planning authority. Home extension data, such as build costs and project timelines, are calculated using approximately 9,000 architectural projects Resi has completed, and 23,500 builders quotes submitted via Resi's platform. Build costs are adjusted according to inflation rates to more accurately represent today's prices.
Map data ©OpenStreetMap contributors.
Rightmove takes no liability for your use of, or reliance on, Rightmove's Instant Valuation due to the limitations of our tracking tool listed here. Use of this tool is taken entirely at your own risk. All rights reserved.

