
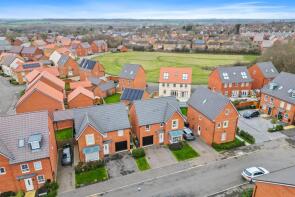
House Prices in Cranford St. Andrew
House prices in Cranford St. Andrew have an overall average of £305,050 over the last year.
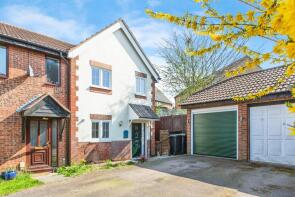
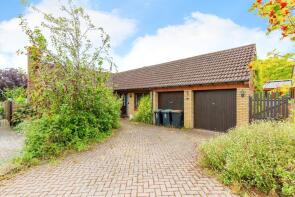
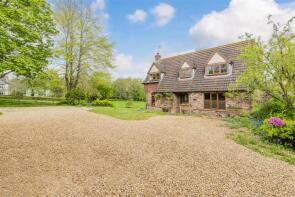
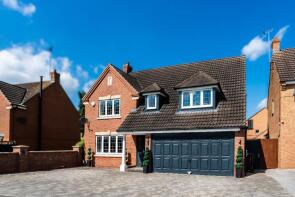
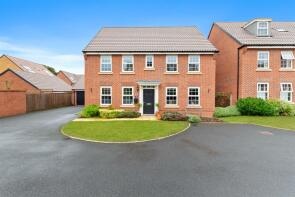
The majority of properties sold in Cranford St. Andrew during the last year were detached properties, selling for an average price of £390,393. Semi-detached properties sold for an average of £281,333, with terraced properties fetching £220,880.
Overall, the historical sold prices in Cranford St. Andrew over the last year were 5% down on the previous year and 8% down on the 2022 peak of £332,595.
Properties Sold
111, Springfield Avenue, Kettering NN14 4TN
| Today | See what it's worth now |
| 12 Dec 2025 | £258,000 |
| 3 Jan 2019 | £195,000 |
6, Chapel Close, Kettering NN14 4RA
| Today | See what it's worth now |
| 9 Dec 2025 | £335,000 |
| 5 Aug 2004 | £284,950 |
No other historical records.
Brook House, Woodford Road, Kettering NN14 4BS
| Today | See what it's worth now |
| 8 Dec 2025 | £660,000 |
| 14 Apr 2003 | £395,250 |
5, Kestrel Drive, Kettering NN14 4GH
| Today | See what it's worth now |
| 5 Dec 2025 | £352,500 |
| 1 Apr 2022 | £329,995 |
No other historical records.
8, Washington Court, Kettering NN14 4TF
| Today | See what it's worth now |
| 5 Dec 2025 | £262,000 |
| 1 Dec 2017 | £206,000 |
39, Foundry Walk, Kettering NN14 4LS
| Today | See what it's worth now |
| 28 Nov 2025 | £330,000 |
| 1 Dec 2014 | £245,000 |
15, Chapel Street, Kettering NN14 4DL
| Today | See what it's worth now |
| 28 Nov 2025 | £270,000 |
| 4 Apr 1997 | £56,500 |
No other historical records.
14, Chainbridge Court, Kettering NN14 4FJ
| Today | See what it's worth now |
| 27 Nov 2025 | £335,000 |
| 25 Jan 2008 | £200,000 |
No other historical records.
13, Rosebery Street, Kettering NN14 4BY
| Today | See what it's worth now |
| 26 Nov 2025 | £265,000 |
| 19 Jan 2022 | £245,000 |
16, Woodpecker Way, Kettering NN14 4RZ
| Today | See what it's worth now |
| 25 Nov 2025 | £360,000 |
| 15 Nov 2019 | £302,995 |
No other historical records.
36, Mill Road, Kettering NN14 4HH
| Today | See what it's worth now |
| 21 Nov 2025 | £290,000 |
| 2 Sep 2004 | £159,950 |
No other historical records.
129, Springfield Avenue, Kettering NN14 4TN
| Today | See what it's worth now |
| 20 Nov 2025 | £270,000 |
| 5 Mar 1999 | £67,950 |
4, Castle Court, Chancery Lane, Kettering NN14 4LL

| Today | See what it's worth now |
| 14 Nov 2025 | £230,000 |
| 15 Jun 2022 | £221,000 |
18, Front Street, Kettering NN14 4EG
| Today | See what it's worth now |
| 7 Nov 2025 | £215,000 |
| 28 Aug 2008 | £250,000 |
Fieldways, Ringstead Road, Kettering NN14 4BW
| Today | See what it's worth now |
| 4 Nov 2025 | £637,500 |
| 24 Oct 2019 | £474,000 |
16, Scotney Way, Kettering NN14 4SA
| Today | See what it's worth now |
| 3 Nov 2025 | £395,000 |
| 11 Aug 2000 | £125,000 |
No other historical records.
8, Back Lane, Kettering NN14 4DR
| Today | See what it's worth now |
| 31 Oct 2025 | £312,500 |
| 8 May 2001 | £78,000 |
No other historical records.
47, Sissinghurst Drive, Kettering NN14 4XQ
| Today | See what it's worth now |
| 27 Oct 2025 | £485,000 |
| 7 Jun 2019 | £370,000 |
42, West Street, Woodford NN14 4HZ


| Today | See what it's worth now |
| 24 Oct 2025 | £295,000 |
No other historical records.
25, St Andrews Lane, Cranford NN14 4AQ

| Today | See what it's worth now |
| 24 Oct 2025 | £490,000 |
No other historical records.
23, Kingfisher Road, Kettering NN14 4GN
| Today | See what it's worth now |
| 24 Oct 2025 | £485,000 |
| 21 Sep 2018 | £422,995 |
No other historical records.
96, Oundle Road, Kettering NN14 4PF

| Today | See what it's worth now |
| 24 Oct 2025 | £290,000 |
| 11 Oct 2016 | £171,000 |
58, Oakleas Rise, Kettering NN14 4JZ
| Today | See what it's worth now |
| 23 Oct 2025 | £390,000 |
| 13 Feb 2015 | £217,000 |
15a, Chancery Lane, Kettering NN14 4JL
| Today | See what it's worth now |
| 23 Oct 2025 | £475,000 |
| 18 Mar 2020 | £230,000 |
4, Blackbird Close, Kettering NN14 4SD
| Today | See what it's worth now |
| 23 Oct 2025 | £380,000 |
| 26 Mar 2020 | £309,495 |
No other historical records.
Source Acknowledgement: © Crown copyright. England and Wales house price data is publicly available information produced by the HM Land Registry.This material was last updated on 4 February 2026. It covers the period from 1 January 1995 to 24 December 2025 and contains property transactions which have been registered during that period. Contains HM Land Registry data © Crown copyright and database right 2026. This data is licensed under the Open Government Licence v3.0.
Disclaimer: Rightmove.co.uk provides this HM Land Registry data "as is". The burden for fitness of the data relies completely with the user and is provided for informational purposes only. No warranty, express or implied, is given relating to the accuracy of content of the HM Land Registry data and Rightmove does not accept any liability for error or omission. If you have found an error with the data or need further information please contact HM Land Registry.
Permitted Use: Viewers of this Information are granted permission to access this Crown copyright material and to download it onto electronic, magnetic, optical or similar storage media provided that such activities are for private research, study or in-house use only. Any other use of the material requires the formal written permission of Land Registry which can be requested from us, and is subject to an additional licence and associated charge.
Map data ©OpenStreetMap contributors.
Rightmove takes no liability for your use of, or reliance on, Rightmove's Instant Valuation due to the limitations of our tracking tool listed here. Use of this tool is taken entirely at your own risk. All rights reserved.