
House Prices in Cuby
House prices in Cuby have an overall average of £833,769 over the last year.
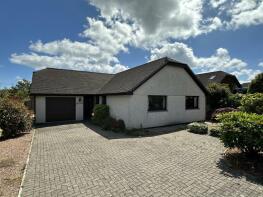
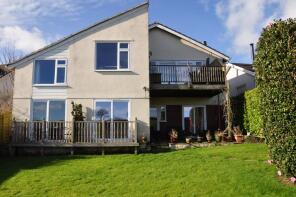
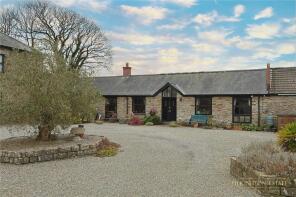
The majority of properties sold in Cuby during the last year were detached properties, selling for an average price of £981,187. Semi-detached properties sold for an average of £735,000, with terraced properties fetching £697,990.
Overall, the historical sold prices in Cuby over the last year were 19% up on the previous year and 29% up on the 2020 peak of £646,336.
Properties Sold
19, Lords Meadow, Truro TR2 5RZ
| Today | See what it's worth now |
| 5 Dec 2025 | £385,000 |
| 11 May 2016 | £255,000 |
Tregantle, A3078 Between Tregony Hill And Junction East Of Sunny Corner, Truro TR2 5TD

| Today | See what it's worth now |
| 25 Nov 2025 | £385,000 |
| 18 Aug 2017 | £340,000 |
4, Parc An Dillon Road, Truro TR2 5DU
| Today | See what it's worth now |
| 7 Nov 2025 | £690,000 |
| 10 Jul 2014 | £385,000 |
Tate & Lyle Cottage, Reskivers, Tregony TR2 5TE
| Today | See what it's worth now |
| 1 Oct 2025 | £185,000 |
No other historical records.
Pendowrick, Pendower Road, Truro TR2 5QL

| Today | See what it's worth now |
| 16 Sep 2025 | £500,000 |
| 17 Oct 2024 | £490,000 |
17 Bay Cottage, Lower Castle Road, Truro TR2 5DR

| Today | See what it's worth now |
| 11 Sep 2025 | £2,000,000 |
| 6 May 2022 | £2,050,000 |
1, Pedlars Row, Road From Lamorran Woods To Junction South Of Creek View, Truro TR2 5NZ


| Today | See what it's worth now |
| 11 Sep 2025 | £370,000 |
| 19 Apr 2002 | £143,500 |
6 Verbena Cottage, Gibraltar Terrace, Truro TR2 5BQ

| Today | See what it's worth now |
| 5 Sep 2025 | £1,400,001 |
| 26 Mar 2021 | £984,500 |
No other historical records.
Lamorna, Tucoyse Farm, Tregony TR2 5SJ
| Today | See what it's worth now |
| 22 Aug 2025 | £275,000 |
No other historical records.
8, The Bowling Green, Truro TR2 5JN
| Today | See what it's worth now |
| 20 Aug 2025 | £387,500 |
| 28 Jun 2000 | £135,000 |
No other historical records.
Pendragon, Polvarth Lane, Truro TR2 5AZ

| Today | See what it's worth now |
| 13 Aug 2025 | £2,400,000 |
No other historical records.
21, Lords Meadow, Tregony TR2 5RZ
| Today | See what it's worth now |
| 30 Jul 2025 | £545,000 |
No other historical records.
8, The Square, Truro TR2 5RS

| Today | See what it's worth now |
| 30 Jul 2025 | £249,950 |
| 2 Aug 2011 | £170,000 |
Carnside, Veryan TR2 5PF
| Today | See what it's worth now |
| 21 Jul 2025 | £775,500 |
No other historical records.
Hawthorn Cottage, A3078 Between Chy Mor And Trethem Mill, Trethewell, St Just In Roseland TR2 5JE
| Today | See what it's worth now |
| 18 Jul 2025 | £363,000 |
No other historical records.
Trewarren, Riviera Lane, Truro TR2 5BG

| Today | See what it's worth now |
| 7 Jul 2025 | £4,000,000 |
| 31 Mar 2021 | £2,750,000 |
4, Tregonhayne Court, Tregony TR2 5SE
| Today | See what it's worth now |
| 24 Jun 2025 | £525,000 |
No other historical records.
56, Parc An Dillon Road, Portscatho TR2 5DU

| Today | See what it's worth now |
| 6 Jun 2025 | £575,000 |
No other historical records.
27a Minerva, Tregony Hill, Truro TR2 5RU
| Today | See what it's worth now |
| 28 May 2025 | £320,000 |
| 29 Jul 1997 | £63,000 |
No other historical records.
5 Wilbury Cottage, Sunnyside, Truro TR2 5HJ

| Today | See what it's worth now |
| 28 May 2025 | £530,000 |
| 12 Dec 2014 | £322,500 |
11 Florence Cottage, Wellington Terrace, Truro TR2 5HN

| Today | See what it's worth now |
| 28 May 2025 | £1,130,000 |
| 24 May 2007 | £470,000 |
Eglos Coth, Trewartha, Veryan TR2 5QJ
| Today | See what it's worth now |
| 21 May 2025 | £948,242 |
No other historical records.
Trewince Manor, Portscatho TR2 5ET

| Today | See what it's worth now |
| 2 May 2025 | £237,500 |
| 30 Jun 2021 | £245,000 |
4, Walled Garden, Roseland Parc, Truro TR2 5FB
| Today | See what it's worth now |
| 27 Mar 2025 | £360,000 |
| 12 Apr 2022 | £320,000 |
No other historical records.
Summers View, Trelawney Road, Truro TR2 5BU
| Today | See what it's worth now |
| 25 Mar 2025 | £1,100,000 |
| 14 Oct 2005 | £395,000 |
No other historical records.
Source Acknowledgement: © Crown copyright. England and Wales house price data is publicly available information produced by the HM Land Registry.This material was last updated on 9 April 2026. It covers the period from 1 January 1995 to 27 February 2026 and contains property transactions which have been registered during that period. Contains HM Land Registry data © Crown copyright and database right 2026. This data is licensed under the Open Government Licence v3.0.
Disclaimer: Rightmove.co.uk provides this HM Land Registry data "as is". The burden for fitness of the data relies completely with the user and is provided for informational purposes only. No warranty, express or implied, is given relating to the accuracy of content of the HM Land Registry data and Rightmove does not accept any liability for error or omission. If you have found an error with the data or need further information please contact HM Land Registry.
Permitted Use: Viewers of this Information are granted permission to access this Crown copyright material and to download it onto electronic, magnetic, optical or similar storage media provided that such activities are for private research, study or in-house use only. Any other use of the material requires the formal written permission of Land Registry which can be requested from us, and is subject to an additional licence and associated charge.
Map data ©OpenStreetMap contributors.
Rightmove takes no liability for your use of, or reliance on, Rightmove's Instant Valuation due to the limitations of our tracking tool listed here. Use of this tool is taken entirely at your own risk. All rights reserved.