
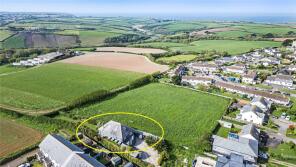
House Prices in Cury Cross Lanes
House prices in Cury Cross Lanes have an overall average of £458,000 over the last year.
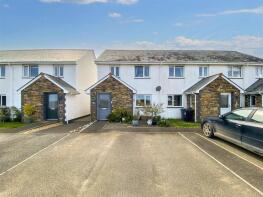
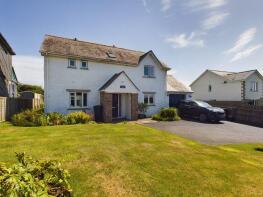
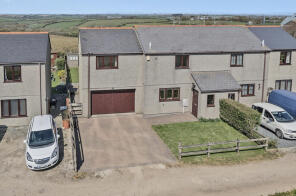
The majority of properties sold in Cury Cross Lanes during the last year were detached properties, selling for an average price of £581,667. Semi-detached properties sold for an average of £280,000, with terraced properties fetching £265,000.
Overall, the historical sold prices in Cury Cross Lanes over the last year were 95% up on the previous year and 13% down on the 2022 peak of £525,000.
Properties Sold
Chy An Huder, White Cross, Helston TR12 7BG
| Today | See what it's worth now |
| 6 Feb 2026 | £675,000 |
| 7 Aug 2017 | £500,000 |
8, Gweal Wollas Fields, White Cross, Helston TR12 7BU
| Today | See what it's worth now |
| 10 Dec 2025 | £265,000 |
| 19 Oct 2018 | £175,000 |
Corantyn Cottage, Cury, Helston TR12 7BS
| Today | See what it's worth now |
| 20 Oct 2025 | £470,000 |
| 28 Aug 2013 | £270,000 |
No other historical records.
3, Gweal Wollas Fields, White Cross, Cury TR12 7BU
| Today | See what it's worth now |
| 27 Aug 2025 | £280,000 |
| 27 Mar 1997 | £37,500 |
Cornerways, Cury Cross Lanes, Helston TR12 7BB


| Today | See what it's worth now |
| 6 Jun 2025 | £600,000 |
| 12 Dec 2007 | £455,000 |
No other historical records.
13, Parc Enys, Helston TR12 7BL

| Today | See what it's worth now |
| 27 Sep 2024 | £235,000 |
| 14 Nov 2018 | £168,500 |
17, Parc Enys, Helston TR12 7BL

| Today | See what it's worth now |
| 17 May 2024 | £235,000 |
| 22 Oct 2001 | £59,000 |
No other historical records.
Tregweath, Church Road, Churchtown, Cury TR12 7BW

| Today | See what it's worth now |
| 13 Jul 2023 | £331,000 |
| 2 Jun 2021 | £290,000 |
No other historical records.
Chy Corantyn, White Cross, Cury TR12 7BG

| Today | See what it's worth now |
| 24 Feb 2023 | £400,000 |
No other historical records.
Sunny Corner, White Cross, Helston TR12 7BG
| Today | See what it's worth now |
| 28 Oct 2022 | £500,000 |
| 26 Feb 2016 | £250,000 |
12 Summerstone House, Gweal Wollas Fields, White Cross, Helston TR12 7BU

| Today | See what it's worth now |
| 23 May 2022 | £550,000 |
| 31 May 2013 | £250,000 |
No other historical records.
Trevow Barn, White Cross, Helston TR12 7BH

| Today | See what it's worth now |
| 24 Sep 2021 | £550,000 |
No other historical records.
Polglase Farm, Chypons Road, Helston TR12 7AY
| Today | See what it's worth now |
| 24 Sep 2021 | £641,000 |
| 1 Jul 2009 | £270,000 |
Colvennor Court, Colvennor, Helston TR12 7BJ

| Today | See what it's worth now |
| 20 Aug 2021 | £400,000 |
No other historical records.
Higher Gwealeath Farm, Gwealeath, Helston TR12 7QU

| Today | See what it's worth now |
| 12 May 2021 | £650,000 |
| 14 Jun 2004 | £375,000 |
No other historical records.
Higher Penvearne, White Cross, Helston TR12 7BH

| Today | See what it's worth now |
| 3 Mar 2021 | £540,000 |
| 3 Mar 2015 | £417,000 |
No other historical records.
Transingove Farm, Cury, Helston TR12 7QY
| Today | See what it's worth now |
| 19 Feb 2021 | £800,000 |
| 15 Dec 2006 | £565,000 |
No other historical records.
8, Trelawney Terrace, Helston TR12 7BG

| Today | See what it's worth now |
| 15 Jan 2021 | £225,000 |
| 15 Nov 2017 | £195,000 |
Riverside, Nantithet, Helston TR12 7RB
| Today | See what it's worth now |
| 8 Jan 2021 | £555,000 |
| 1 Jun 2012 | £425,000 |
Little Oaks, Gilly Hill, Nantithet, Helston TR12 7RB

| Today | See what it's worth now |
| 27 Nov 2020 | £255,000 |
No other historical records.
Little Poleskan Farm, Nantithet, Helston TR12 7RB

| Today | See what it's worth now |
| 24 Nov 2020 | £440,000 |
No other historical records.
Glen Cottage, White Cross, Helston TR12 7BH

| Today | See what it's worth now |
| 14 Oct 2020 | £166,000 |
| 28 Oct 2016 | £159,950 |
No other historical records.
7, Gweal Wollas Fields, White Cross, Helston TR12 7BU
| Today | See what it's worth now |
| 9 Oct 2020 | £178,500 |
| 27 Sep 2012 | £136,500 |
Gweal Wollas, White Cross, Helston TR12 7BG

| Today | See what it's worth now |
| 4 Aug 2020 | £327,500 |
No other historical records.
Trevarrick, Nantithet, Helston TR12 7RB

| Today | See what it's worth now |
| 6 Dec 2019 | £396,000 |
No other historical records.
Source Acknowledgement: © Crown copyright. England and Wales house price data is publicly available information produced by the HM Land Registry.This material was last updated on 9 April 2026. It covers the period from 1 January 1995 to 27 February 2026 and contains property transactions which have been registered during that period. Contains HM Land Registry data © Crown copyright and database right 2026. This data is licensed under the Open Government Licence v3.0.
Disclaimer: Rightmove.co.uk provides this HM Land Registry data "as is". The burden for fitness of the data relies completely with the user and is provided for informational purposes only. No warranty, express or implied, is given relating to the accuracy of content of the HM Land Registry data and Rightmove does not accept any liability for error or omission. If you have found an error with the data or need further information please contact HM Land Registry.
Permitted Use: Viewers of this Information are granted permission to access this Crown copyright material and to download it onto electronic, magnetic, optical or similar storage media provided that such activities are for private research, study or in-house use only. Any other use of the material requires the formal written permission of Land Registry which can be requested from us, and is subject to an additional licence and associated charge.
Map data ©OpenStreetMap contributors.
Rightmove takes no liability for your use of, or reliance on, Rightmove's Instant Valuation due to the limitations of our tracking tool listed here. Use of this tool is taken entirely at your own risk. All rights reserved.