
House Prices in Dulwich
House prices in Dulwich have an overall average of £883,208 over the last year.
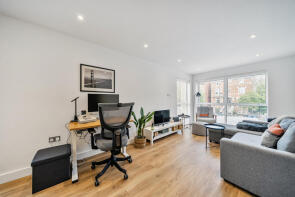
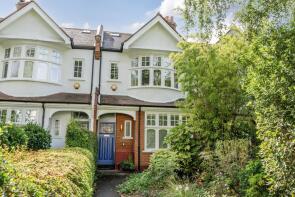
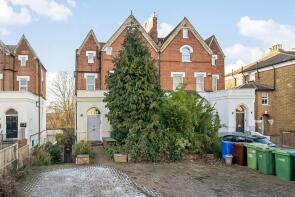
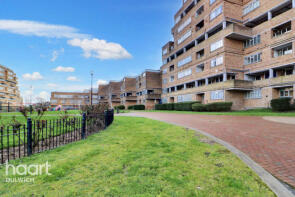
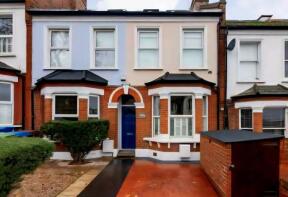
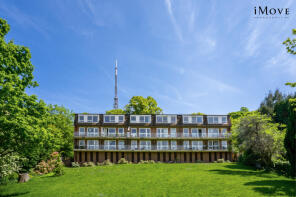
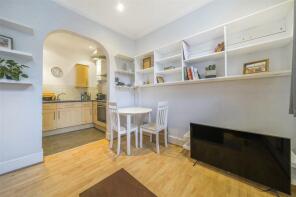
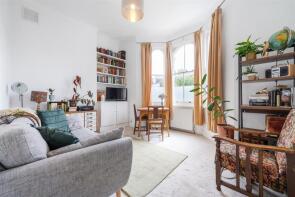
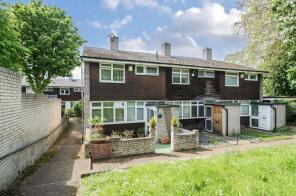
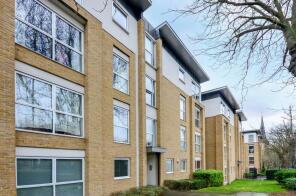
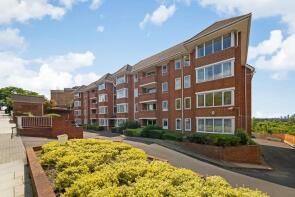
The majority of properties sold in Dulwich during the last year were flats, selling for an average price of £496,796. Terraced properties sold for an average of £1,110,082, with semi-detached properties fetching £1,508,401.
Overall, the historical sold prices in Dulwich over the last year were 1% up on the previous year and 2% up on the 2023 peak of £869,097.
Properties Sold
7, Epping Court, Highwood Close, London SE22 8NJ
| Today | See what it's worth now |
| 28 Apr 2026 | £275,000 |
| 27 May 2021 | £295,000 |
386, Lordship Lane, London SE22 8ND
| Today | See what it's worth now |
| 20 Apr 2026 | £1,000,000 |
No other historical records.
21a, Wood Vale, London SE23 3DS
| Today | See what it's worth now |
| 17 Apr 2026 | £462,500 |
| 20 Oct 2017 | £530,000 |
163, Ladlands, Overhill Road, London SE22 0PW
| Today | See what it's worth now |
| 17 Apr 2026 | £340,000 |
| 4 May 2004 | £142,000 |
No other historical records.
199a, Underhill Road, London SE22 0PD
| Today | See what it's worth now |
| 17 Apr 2026 | £810,000 |
| 26 Jan 2011 | £420,000 |
13, Sherwood Court, Highwood Close, London SE22 8NL

| Today | See what it's worth now |
| 13 Apr 2026 | £345,000 |
| 25 Apr 2019 | £343,000 |
220, Clive Road, London SE21 8BS

| Today | See what it's worth now |
| 10 Apr 2026 | £1,340,000 |
No other historical records.
158a, Landells Road, London SE22 9PN

| Today | See what it's worth now |
| 8 Apr 2026 | £736,000 |
| 9 Nov 2012 | £425,000 |
No other historical records.
Flat 14, 61 Cotman Court, Farquhar Road, London SE19 1SN
| Today | See what it's worth now |
| 7 Apr 2026 | £402,000 |
| 28 Aug 1998 | £70,000 |
No other historical records.
Flat 2, Olivia Court, Melbourne Grove, London SE22 8SF
| Today | See what it's worth now |
| 1 Apr 2026 | £325,000 |
| 16 Oct 2015 | £347,500 |
Basement Flat, 5, Martell Road, London SE21 8EA
| Today | See what it's worth now |
| 31 Mar 2026 | £330,000 |
| 13 Dec 2023 | £310,000 |
10, Spenser Mews, London SE21 8SN
| Today | See what it's worth now |
| 31 Mar 2026 | £1,000,000 |
| 10 Apr 2006 | £355,000 |
Flat 33, Walcot House East Dulwich Estate, Albrighton Road, London SE22 8AD
| Today | See what it's worth now |
| 31 Mar 2026 | £405,000 |
| 28 Oct 2022 | £400,000 |
Flat 17, Hogarth Court, Fountain Drive, London SE19 1UY

| Today | See what it's worth now |
| 30 Mar 2026 | £330,000 |
| 18 Nov 2021 | £305,000 |
15, Jennings Road, London SE22 9JU
| Today | See what it's worth now |
| 27 Mar 2026 | £890,000 |
| 1 Nov 2018 | £750,000 |
113b, East Dulwich Grove, London SE22 8PU
| Today | See what it's worth now |
| 27 Mar 2026 | £567,000 |
No other historical records.
182, Clive Road, London SE21 8BS
| Today | See what it's worth now |
| 27 Mar 2026 | £1,100,000 |
No other historical records.
Flat 2, 377, Upland Road, London SE22 0DR
| Today | See what it's worth now |
| 27 Mar 2026 | £625,000 |
| 3 Aug 2018 | £580,000 |
67, North Crofts Sydenham Hill Estate, Sydenham Hill, London SE23 3PS
| Today | See what it's worth now |
| 27 Mar 2026 | £550,000 |
| 18 Dec 2000 | £130,000 |
7, Sherwood Court, Highwood Close, London SE22 8NL
| Today | See what it's worth now |
| 20 Mar 2026 | £317,500 |
| 11 Dec 2009 | £232,500 |
Flat 16, Cityview Court, Overhill Road, London SE22 0PZ
| Today | See what it's worth now |
| 20 Mar 2026 | £410,000 |
| 17 Nov 2023 | £410,000 |
14, Abbotswood Road, London SE22 8DL
| Today | See what it's worth now |
| 20 Mar 2026 | £700,000 |
| 8 Sep 2008 | £295,000 |
41, Abbotswood Road, London SE22 8DJ
| Today | See what it's worth now |
| 18 Mar 2026 | £890,000 |
| 21 Dec 2022 | £860,000 |

Source Acknowledgement: © Crown copyright. England and Wales house price data is publicly available information produced by the HM Land Registry.This material was last updated on 9 July 2026. It covers the period from 1 January 1995 to 30 April 2026 and contains property transactions which have been registered during that period. Contains HM Land Registry data © Crown copyright and database right 2026. This data is licensed under the Open Government Licence v3.0.
Disclaimer: Rightmove.co.uk provides this HM Land Registry data "as is". The burden for fitness of the data relies completely with the user and is provided for informational purposes only. No warranty, express or implied, is given relating to the accuracy of content of the HM Land Registry data and Rightmove does not accept any liability for error or omission. If you have found an error with the data or need further information please contact HM Land Registry.
Permitted Use: Viewers of this Information are granted permission to access this Crown copyright material and to download it onto electronic, magnetic, optical or similar storage media provided that such activities are for private research, study or in-house use only. Any other use of the material requires the formal written permission of Land Registry which can be requested from us, and is subject to an additional licence and associated charge.
Rightmove takes no liability for your use of, or reliance on, Rightmove's Instant Valuation due to the limitations of our tracking tool listed here. Use of this tool is taken entirely at your own risk. All rights reserved.