
House Prices in E11
House prices in E11 have an overall average of £650,603 over the last year.
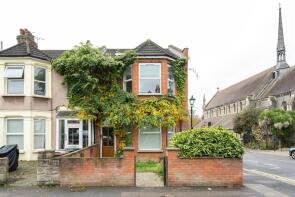
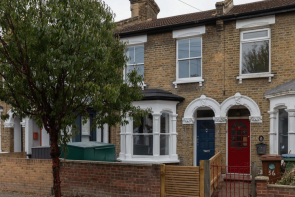
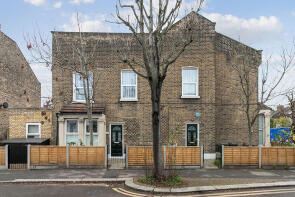
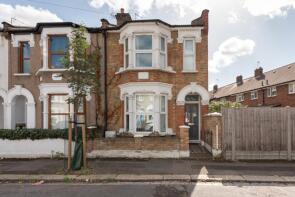
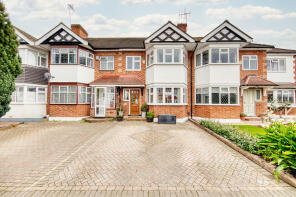
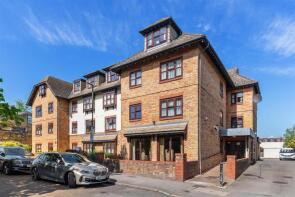
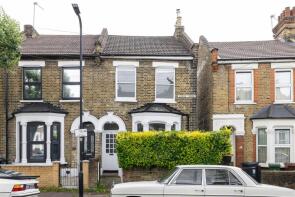
The majority of properties sold in E11 during the last year were flats, selling for an average price of £383,782. Terraced properties sold for an average of £789,800, with semi-detached properties fetching £1,042,785.
Overall, the historical sold prices in E11 over the last year were similar to the previous year and 2% up on the 2023 peak of £634,849.
Properties Sold
153, Cavendish Drive, London E11 1DJ
| Today | See what it's worth now |
| 24 Apr 2026 | £790,000 |
| 10 Feb 2023 | £685,000 |
5, 103 Hedge Court, Hainault Road, London E11 1DU
| Today | See what it's worth now |
| 21 Apr 2026 | £268,000 |
| 20 Oct 2006 | £140,000 |
37a, Melford Road, Leytonstone E11 4PR

| Today | See what it's worth now |
| 16 Apr 2026 | £465,000 |
No other historical records.
Extensions and planning permission in E11
See planning approval stats, extension build costs and value added estimates.

3, Esther Road, London E11 1JB
| Today | See what it's worth now |
| 15 Apr 2026 | £825,000 |
| 30 Jul 2018 | £710,000 |
No other historical records.
1, Wragby Road, London E11 3LD

| Today | See what it's worth now |
| 13 Apr 2026 | £686,000 |
| 27 Mar 2025 | £360,000 |
Flat 3, The Ridings, Malcolm Way, Wanstead, London E11 1SU

| Today | See what it's worth now |
| 13 Apr 2026 | £432,000 |
| 26 Feb 2010 | £293,000 |
8, Eve Road, Leytonstone E11 3JE
| Today | See what it's worth now |
| 9 Apr 2026 | £767,500 |
No other historical records.
63, Cheneys Road, London E11 3LL
| Today | See what it's worth now |
| 2 Apr 2026 | £750,000 |
| 12 Nov 2021 | £560,000 |
No other historical records.
127, Poppleton Road, London E11 1LS
| Today | See what it's worth now |
| 1 Apr 2026 | £360,000 |
| 1 Sep 2021 | £330,000 |
54, Kingsdown Road, London E11 3LP
| Today | See what it's worth now |
| 1 Apr 2026 | £685,000 |
| 15 Jan 2021 | £582,000 |
64a, Norman Road, London E11 4RL
| Today | See what it's worth now |
| 31 Mar 2026 | £338,000 |
| 30 Mar 2006 | £119,000 |
No other historical records.
96, Melford Road, London E11 4PS
| Today | See what it's worth now |
| 30 Mar 2026 | £715,000 |
| 9 May 2014 | £390,000 |
29d, Grosvenor Road, Wanstead, London E11 2EW

| Today | See what it's worth now |
| 27 Mar 2026 | £449,950 |
| 30 Jun 2021 | £396,000 |
102, Ferndale Road, London E11 3DN
| Today | See what it's worth now |
| 27 Mar 2026 | £1,080,000 |
| 14 Oct 2016 | £600,000 |
No other historical records.
4a, Hainault Road, London E11 1EE

| Today | See what it's worth now |
| 26 Mar 2026 | £481,000 |
| 30 Sep 2022 | £443,750 |
113, Woodlands Avenue, Wanstead, London E11 3RB
| Today | See what it's worth now |
| 25 Mar 2026 | £1,140,000 |
No other historical records.
10, Lake House Road, Wanstead, London E11 3QS
| Today | See what it's worth now |
| 24 Mar 2026 | £890,000 |
| 29 Aug 2001 | £230,000 |
No other historical records.
41, 675 Marnie Court, High Road Leytonstone, London E11 4RB
| Today | See what it's worth now |
| 23 Mar 2026 | £420,000 |
| 22 Feb 2017 | £420,000 |
No other historical records.
Flat 18, Highstone Court, New Wanstead, Wanstead, London E11 2SE
| Today | See what it's worth now |
| 23 Mar 2026 | £420,000 |
| 24 Jun 2022 | £400,000 |
4, Leslie Road, London E11 4HG

| Today | See what it's worth now |
| 20 Mar 2026 | £191,714 |
| 27 Sep 2002 | £216,000 |
15, Colvin Gardens, Wanstead, London E11 2DD
| Today | See what it's worth now |
| 20 Mar 2026 | £795,000 |
| 3 Feb 1999 | £140,000 |
No other historical records.
Flat 12, 2 Westleigh Court, Nightingale Lane, Wanstead, London E11 2XA
| Today | See what it's worth now |
| 20 Mar 2026 | £183,500 |
| 27 Feb 2015 | £200,000 |
100, Leslie Road, London E11 4HG
| Today | See what it's worth now |
| 19 Mar 2026 | £725,000 |
| 31 Mar 2020 | £470,000 |
No other historical records.
Source Acknowledgement: © Crown copyright. England and Wales house price data is publicly available information produced by the HM Land Registry.This material was last updated on 9 July 2026. It covers the period from 1 January 1995 to 30 April 2026 and contains property transactions which have been registered during that period. Contains HM Land Registry data © Crown copyright and database right 2026. This data is licensed under the Open Government Licence v3.0.
Disclaimer: Rightmove.co.uk provides this HM Land Registry data "as is". The burden for fitness of the data relies completely with the user and is provided for informational purposes only. No warranty, express or implied, is given relating to the accuracy of content of the HM Land Registry data and Rightmove does not accept any liability for error or omission. If you have found an error with the data or need further information please contact HM Land Registry.
Permitted Use: Viewers of this Information are granted permission to access this Crown copyright material and to download it onto electronic, magnetic, optical or similar storage media provided that such activities are for private research, study or in-house use only. Any other use of the material requires the formal written permission of Land Registry which can be requested from us, and is subject to an additional licence and associated charge.
Rightmove takes no liability for your use of, or reliance on, Rightmove's Instant Valuation due to the limitations of our tracking tool listed here. Use of this tool is taken entirely at your own risk. All rights reserved.