
House Prices in Chingford Avenue, Chingford, London, Waltham Forest, E4
House prices in Chingford Avenue have an overall average of £334,900 over the last year.
Overall, the historical sold prices in Chingford Avenue over the last year were 36% down on the previous year and 19% down on the 2021 peak of £412,025.
Properties Sold
41a, Chingford Avenue, Chingford E4 6RJ

| Today | See what it's worth now |
| 16 Jun 2025 | £407,500 |
| 3 Jun 2021 | £372,500 |
44a, Chingford Avenue, London E4 6RP

| Today | See what it's worth now |
| 5 Dec 2024 | £375,000 |
| 10 Jul 2015 | £280,000 |
6, 73 Magnolia Lodge, Chingford Avenue, London E4 6SX
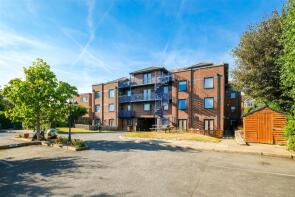
| Today | See what it's worth now |
| 2 Sep 2024 | £265,000 |
| 11 Jun 2015 | £186,000 |
9, 69 Aldborough Court, Chingford Avenue, London E4 6RW
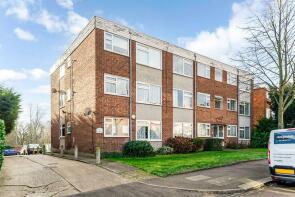
| Today | See what it's worth now |
| 23 Aug 2024 | £312,000 |
| 3 Dec 2004 | £163,000 |
No other historical records.
32, 45 Ingrebourne Court, Chingford Avenue, London E4 6RL
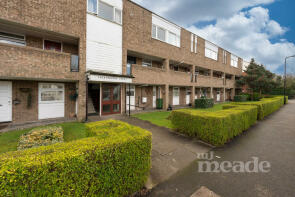
| Today | See what it's worth now |
| 12 Aug 2024 | £315,000 |
| 22 Jul 2013 | £187,000 |
No other historical records.
86, Chingford Avenue, London E4 6RP

| Today | See what it's worth now |
| 26 Jul 2024 | £730,000 |
| 26 Oct 2018 | £575,000 |
24, 45 Ingrebourne Court, Chingford Avenue, London E4 6RL

| Today | See what it's worth now |
| 12 Apr 2024 | £232,500 |
| 20 Jun 2014 | £150,000 |
12, 69 Aldborough Court, Chingford Avenue, London E4 6RW
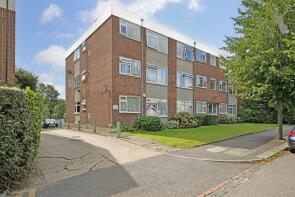
| Today | See what it's worth now |
| 2 Apr 2024 | £300,000 |
| 11 Oct 2017 | £295,000 |
26, 45 Ingrebourne Court, Chingford Avenue, London E4 6RL
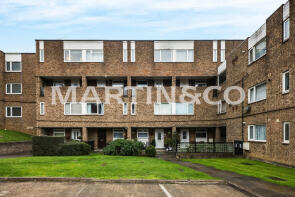
| Today | See what it's worth now |
| 23 Feb 2024 | £345,000 |
| 19 Apr 1996 | £43,000 |
No other historical records.
87, Chingford Avenue, London E4 6RG

| Today | See what it's worth now |
| 20 Nov 2023 | £475,000 |
| 22 Jun 2007 | £300,000 |
5, Chingford Avenue, London E4 6RJ

| Today | See what it's worth now |
| 1 Sep 2023 | £890,000 |
| 6 Nov 2009 | £315,000 |
No other historical records.
107, Chingford Avenue, London E4 6RG

| Today | See what it's worth now |
| 11 Aug 2023 | £665,000 |
No other historical records.
70, Chingford Avenue, London E4 6RP
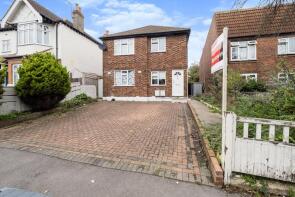
| Today | See what it's worth now |
| 27 Apr 2023 | £345,000 |
| 28 Nov 2018 | £330,000 |
132, Chingford Avenue, London E4 6RF
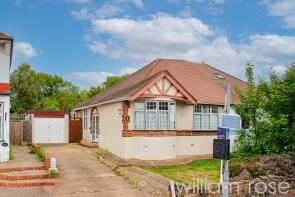
| Today | See what it's worth now |
| 30 Mar 2023 | £425,000 |
No other historical records.
16, 73 Magnolia Lodge, Chingford Avenue, London E4 6SX
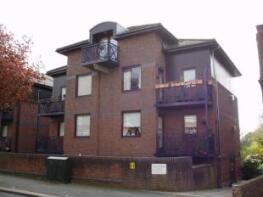
| Today | See what it's worth now |
| 13 Dec 2022 | £344,995 |
| 26 Mar 2021 | £330,000 |
16, 57 Celandine Court, Chingford Avenue, London E4 6SQ
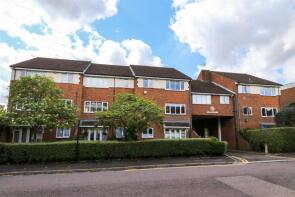
| Today | See what it's worth now |
| 28 Nov 2022 | £335,000 |
| 14 Mar 2002 | £120,000 |
3, 71 Phoenix Court, Chingford Avenue, London E4 6RH
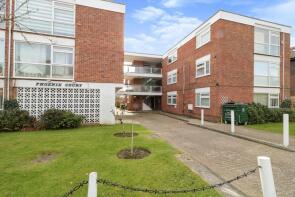
| Today | See what it's worth now |
| 6 Oct 2022 | £280,000 |
| 17 Apr 2020 | £230,000 |
32, Chingford Avenue, London E4 6RP

| Today | See what it's worth now |
| 4 May 2022 | £775,000 |
| 26 Aug 2016 | £610,000 |
54, Chingford Avenue, London E4 6RP

| Today | See what it's worth now |
| 13 Apr 2022 | £570,000 |
No other historical records.
16, 71 Phoenix Court, Chingford Avenue, London E4 6RH
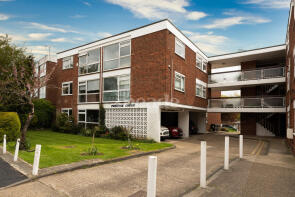
| Today | See what it's worth now |
| 18 Feb 2022 | £297,000 |
| 16 Feb 1998 | £79,995 |
No other historical records.
5, 71 Phoenix Court, Chingford Avenue, London E4 6RH
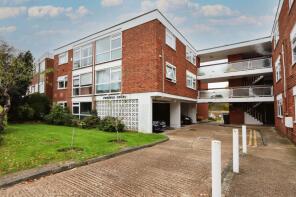
| Today | See what it's worth now |
| 25 Jan 2022 | £280,000 |
| 26 Jul 2007 | £170,000 |
No other historical records.
17, 71 Phoenix Court, Chingford Avenue, London E4 6RH

| Today | See what it's worth now |
| 17 Dec 2021 | £225,000 |
| 3 Feb 2011 | £172,500 |
116, Chingford Avenue, London E4 6RF

| Today | See what it's worth now |
| 30 Nov 2021 | £650,000 |
| 22 Apr 2015 | £352,500 |
5, 57 Celandine Court, Chingford Avenue, London E4 6SQ
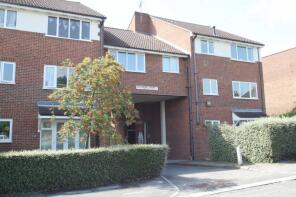
| Today | See what it's worth now |
| 26 Nov 2021 | £318,000 |
| 18 Jun 2004 | £167,000 |
119, Chingford Avenue, London E4 6RG
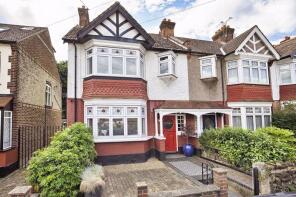
| Today | See what it's worth now |
| 26 Nov 2021 | £620,000 |
| 2 Dec 2016 | £515,000 |
Find out how much your property is worth
The following agents can provide you with a free, no-obligation valuation. Simply select the ones you'd like to hear from.
Sponsored
All featured agents have paid a fee to promote their valuation expertise.

Kings Group
Chingford

Douglas Allen
Covering Chingford

Foxtons
Walthamstow

William Rose
Highams Park & Chingford

Purplebricks
Nationwide

Churchill Estates
North Chingford & Sewardstone
Get ready with a Mortgage in Principle
- Personalised result in just 20 minutes
- Find out how much you can borrow
- Get viewings faster with agents
- No impact on your credit score
What's your property worth?
House prices near Chingford Avenue
Source Acknowledgement: © Crown copyright. England and Wales house price data is publicly available information produced by the HM Land Registry.This material was last updated on 16 July 2025. It covers the period from 1 January 1995 to 30 May 2025 and contains property transactions which have been registered during that period. Contains HM Land Registry data © Crown copyright and database right 2025. This data is licensed under the Open Government Licence v3.0.
Disclaimer: Rightmove.co.uk provides this HM Land Registry data "as is". The burden for fitness of the data relies completely with the user and is provided for informational purposes only. No warranty, express or implied, is given relating to the accuracy of content of the HM Land Registry data and Rightmove does not accept any liability for error or omission. If you have found an error with the data or need further information please contact HM Land Registry.
Permitted Use: Viewers of this Information are granted permission to access this Crown copyright material and to download it onto electronic, magnetic, optical or similar storage media provided that such activities are for private research, study or in-house use only. Any other use of the material requires the formal written permission of Land Registry which can be requested from us, and is subject to an additional licence and associated charge.
Data on planning applications, home extensions and build costs is provided by Resi.co.uk. Planning data is calculated using the last 2 years of residential applications within the selected planning authority. Home extension data, such as build costs and project timelines, are calculated using approximately 9,000 architectural projects Resi has completed, and 23,500 builders quotes submitted via Resi's platform. Build costs are adjusted according to inflation rates to more accurately represent today's prices.
Map data ©OpenStreetMap contributors.
Rightmove takes no liability for your use of, or reliance on, Rightmove's Instant Valuation due to the limitations of our tracking tool listed here. Use of this tool is taken entirely at your own risk. All rights reserved.
