
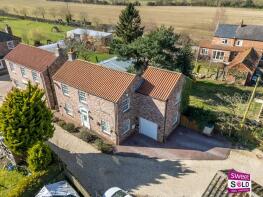
House Prices in East Cottingwith
House prices in East Cottingwith have an overall average of £372,500 over the last year.
Overall, the historical sold prices in East Cottingwith over the last year were 19% up on the previous year and 20% down on the 2011 peak of £467,500.
Properties Sold
4 Lamlash, Canal Lane, York YO42 4TJ

| Today | See what it's worth now |
| 24 Oct 2025 | £425,000 |
| 3 Feb 2020 | £302,000 |
1, The Rowans, York YO42 4SD
| Today | See what it's worth now |
| 24 Oct 2025 | £320,000 |
| 25 Jan 2019 | £245,000 |
1, Swan Garth, Green Lane, York YO42 4TS

| Today | See what it's worth now |
| 21 Feb 2025 | £240,000 |
| 19 Dec 2023 | £193,500 |
No other historical records.
5, The Croft, Main Street, York YO42 4UA
| Today | See what it's worth now |
| 23 Jan 2025 | £385,000 |
| 18 Aug 2021 | £358,000 |
4, Derwent Close, Hagg Lane, York YO42 4TY
| Today | See what it's worth now |
| 19 Dec 2023 | £320,000 |
| 25 May 2001 | £86,000 |
No other historical records.
Derwent View, Middleton Farm, Main Street, East Cottingwith YO42 4TN
| Today | See what it's worth now |
| 11 Oct 2023 | £577,000 |
| 13 Nov 2015 | £380,000 |
3, The Rowans, York YO42 4SD

| Today | See what it's worth now |
| 7 Jan 2022 | £560,000 |
| 29 May 2015 | £350,000 |
Wayside, Ings Lane, York YO42 4TW

| Today | See what it's worth now |
| 6 Jan 2022 | £295,000 |
| 23 Oct 2009 | £200,000 |
Ings House, Canal Lane, York YO42 4TJ

| Today | See what it's worth now |
| 15 Sep 2021 | £390,000 |
| 26 Oct 2017 | £330,000 |
Parnall House, Middleton Farm, Main Street, East Cottingwith YO42 4TN
| Today | See what it's worth now |
| 16 Mar 2021 | £525,000 |
| 29 Mar 2012 | £350,600 |
Little White Cottage, Main Street, York YO42 4TN

| Today | See what it's worth now |
| 8 Mar 2021 | £310,000 |
| 15 Aug 2016 | £260,000 |
Harvest Grange, Langrickgate Lane, York YO42 4TH

| Today | See what it's worth now |
| 1 Mar 2021 | £513,000 |
| 23 Aug 2017 | £505,000 |
The Fold, Langrickgate Lane, York YO42 4TH

| Today | See what it's worth now |
| 9 Dec 2020 | £372,000 |
No other historical records.
Midway, Green Lane, York YO42 4TT
| Today | See what it's worth now |
| 4 Dec 2020 | £265,000 |
| 4 Dec 2017 | £210,000 |
6 Bluebell Cottage, St Marys Close, York YO42 4TZ
| Today | See what it's worth now |
| 20 Nov 2020 | £370,000 |
No other historical records.
3 Beechwood House, St Marys Close, York YO42 4TZ

| Today | See what it's worth now |
| 6 Nov 2020 | £370,000 |
No other historical records.
Hollyhock House, Langrickgate Lane, York YO42 4TH
| Today | See what it's worth now |
| 22 Nov 2019 | £350,000 |
No other historical records.
Warren House, Main Street, York YO42 4TN

| Today | See what it's worth now |
| 18 Nov 2019 | £372,500 |
| 29 Oct 2010 | £265,000 |
Anncliffe House, Green Lane, York YO42 4TT
| Today | See what it's worth now |
| 3 Sep 2019 | £210,000 |
No other historical records.
5, Swan Garth, Green Lane, York YO42 4TS
| Today | See what it's worth now |
| 17 Jun 2019 | £238,000 |
No other historical records.
1, Hagg Lane, York YO42 4TP
| Today | See what it's worth now |
| 8 Feb 2019 | £115,000 |
No other historical records.
Seed Hay Barn, Church Lane, York YO42 4TL
| Today | See what it's worth now |
| 10 Aug 2018 | £565,000 |
| 26 Sep 1997 | £50,000 |
No other historical records.
The Old Post Office, Langrickgate Lane, York YO42 4TH

| Today | See what it's worth now |
| 16 Jul 2018 | £312,500 |
| 5 Aug 2009 | £237,500 |
No other historical records.

Source Acknowledgement: © Crown copyright. England and Wales house price data is publicly available information produced by the HM Land Registry.This material was last updated on 9 July 2026. It covers the period from 1 January 1995 to 30 April 2026 and contains property transactions which have been registered during that period. Contains HM Land Registry data © Crown copyright and database right 2026. This data is licensed under the Open Government Licence v3.0.
Disclaimer: Rightmove.co.uk provides this HM Land Registry data "as is". The burden for fitness of the data relies completely with the user and is provided for informational purposes only. No warranty, express or implied, is given relating to the accuracy of content of the HM Land Registry data and Rightmove does not accept any liability for error or omission. If you have found an error with the data or need further information please contact HM Land Registry.
Permitted Use: Viewers of this Information are granted permission to access this Crown copyright material and to download it onto electronic, magnetic, optical or similar storage media provided that such activities are for private research, study or in-house use only. Any other use of the material requires the formal written permission of Land Registry which can be requested from us, and is subject to an additional licence and associated charge.
Rightmove takes no liability for your use of, or reliance on, Rightmove's Instant Valuation due to the limitations of our tracking tool listed here. Use of this tool is taken entirely at your own risk. All rights reserved.