
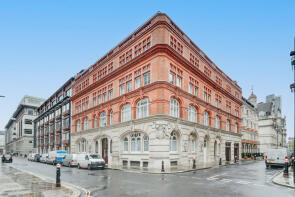
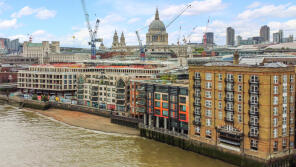
House Prices in EC4
House prices in EC4 have an overall average of £750,828 over the last year.
Overall, the historical sold prices in EC4 over the last year were 6% up on the previous year and 35% down on the 2016 peak of £1,153,522.
Properties Sold
Apartment 13, 25 Victoria House, Tudor Street, London EC4Y 0DD
| Today | See what it's worth now |
| 30 Mar 2026 | £823,000 |
| 11 Jun 2003 | £519,950 |
No other historical records.
Apartment 41, 133 137 St Dunstan's House, Fetter Lane, London EC4A 1BF

| Today | See what it's worth now |
| 2 Mar 2026 | £605,000 |
| 15 Dec 2014 | £777,400 |
No other historical records.
Apartment 6, 25 Victoria House, Tudor Street, London EC4Y 0DD
| Today | See what it's worth now |
| 16 Jan 2026 | £870,000 |
| 26 Jan 2015 | £900,000 |
Apartment 29, 133 137 St Dunstan's House, Fetter Lane, London EC4A 1BF
| Today | See what it's worth now |
| 9 Jan 2026 | £725,000 |
| 24 Feb 2015 | £1,070,000 |
No other historical records.
Flat 1, 68 Cathedral Court, Carter Lane, London EC4V 5EG

| Today | See what it's worth now |
| 15 Dec 2025 | £878,580 |
| 30 Sep 2021 | £870,000 |
Flat 8, Norfolk House, Trig Lane, London EC4V 3QQ
| Today | See what it's worth now |
| 20 Nov 2025 | £735,000 |
| 12 May 1997 | £300,000 |
No other historical records.
Flat 221, 58 Queen's Quay, Upper Thames Street, London EC4V 3EJ
| Today | See what it's worth now |
| 19 Nov 2025 | £927,000 |
| 7 May 2003 | £480,000 |
Flat 14, 7 Pemberton House, Pemberton Row, London EC4A 3BA
| Today | See what it's worth now |
| 14 Nov 2025 | £537,500 |
| 27 Mar 1998 | £160,000 |
No other historical records.
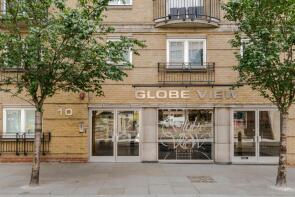
Apartment 103, 10 Globe View, High Timber Street, London EC4V 3PS
| Today | See what it's worth now |
| 3 Oct 2025 | £655,000 |
| 28 Nov 2003 | £315,000 |
Flat 6, Dean Wace House, Wine Office Court, London EC4A 3BY
| Today | See what it's worth now |
| 25 Sep 2025 | £615,000 |
| 16 Dec 1999 | £245,000 |
No other historical records.
Flat 14, 35, Furnival Street, London EC4A 1JQ
| Today | See what it's worth now |
| 23 Sep 2025 | £425,000 |
| 11 Feb 2000 | £180,000 |
No other historical records.
89, Clifford's Inn, Fetter Lane, London EC4A 1BX

| Today | See what it's worth now |
| 22 Aug 2025 | £500,000 |
| 2 Sep 2022 | £575,000 |
Flat 2 Third Floor Rear, The George, Strand, London WC2R 1AP
| Today | See what it's worth now |
| 22 Aug 2025 | £900,000 |
No other historical records.
Flat 15, 3, Ludgate Square, London EC4M 7AS

| Today | See what it's worth now |
| 21 Aug 2025 | £625,000 |
| 5 Aug 2022 | £697,000 |
Flat 409, 58 Queen's Quay, Upper Thames Street, London EC4V 3EH

| Today | See what it's worth now |
| 21 Aug 2025 | £445,000 |
| 20 Oct 2010 | £300,000 |
No other historical records.
Apartment 1, 227-228, Strand, London WC2R 1BE

| Today | See what it's worth now |
| 24 Jul 2025 | £2,100,000 |
No other historical records.
Flat 314, 58 Queen's Quay, Upper Thames Street, London EC4V 3EJ

| Today | See what it's worth now |
| 10 Jul 2025 | £398,000 |
| 8 Jan 2010 | £266,000 |
No other historical records.
Apartment 2, 10 Globe View, High Timber Street, London EC4V 3PL
| Today | See what it's worth now |
| 20 Jun 2025 | £485,000 |
| 17 Dec 1999 | £155,000 |
No other historical records.
Apartment 22, 10 Globe View, High Timber Street, London EC4V 3PL
| Today | See what it's worth now |
| 16 May 2025 | £610,000 |
| 9 Oct 2015 | £620,000 |
168, Clifford's Inn, Fetter Lane, London EC4A 1BY
| Today | See what it's worth now |
| 31 Mar 2025 | £770,000 |
No other historical records.
Flat 1a, 4-7, Red Lion Court, London EC4A 3EB
| Today | See what it's worth now |
| 31 Mar 2025 | £495,000 |
No other historical records.
Flat 1, 12, Well Court, London EC4M 9DN

| Today | See what it's worth now |
| 28 Mar 2025 | £475,000 |
| 21 Mar 2014 | £408,485 |
Flat 1, 19 20 Whittington House, College Hill, London EC4R 2RP
| Today | See what it's worth now |
| 27 Mar 2025 | £625,000 |
| 1 Dec 2023 | £625,000 |

Source Acknowledgement: © Crown copyright. England and Wales house price data is publicly available information produced by the HM Land Registry.This material was last updated on 9 July 2026. It covers the period from 1 January 1995 to 30 April 2026 and contains property transactions which have been registered during that period. Contains HM Land Registry data © Crown copyright and database right 2026. This data is licensed under the Open Government Licence v3.0.
Disclaimer: Rightmove.co.uk provides this HM Land Registry data "as is". The burden for fitness of the data relies completely with the user and is provided for informational purposes only. No warranty, express or implied, is given relating to the accuracy of content of the HM Land Registry data and Rightmove does not accept any liability for error or omission. If you have found an error with the data or need further information please contact HM Land Registry.
Permitted Use: Viewers of this Information are granted permission to access this Crown copyright material and to download it onto electronic, magnetic, optical or similar storage media provided that such activities are for private research, study or in-house use only. Any other use of the material requires the formal written permission of Land Registry which can be requested from us, and is subject to an additional licence and associated charge.
Rightmove takes no liability for your use of, or reliance on, Rightmove's Instant Valuation due to the limitations of our tracking tool listed here. Use of this tool is taken entirely at your own risk. All rights reserved.