
House Prices in Manning Avenue, Cullompton, Devon, EX15
House prices in Manning Avenue have an overall average of £369,500 over the last year.
Overall, the historical sold prices in Manning Avenue over the last year were similar to the previous year and 2% down on the 2022 peak of £376,667.
Properties Sold
11, Manning Avenue, Cullompton, Devon EX15 1QE
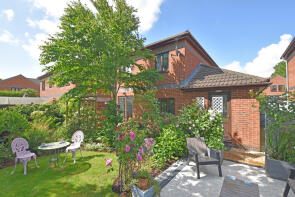
| Today | See what it's worth now |
| 5 Mar 2025 | £340,000 |
| 25 Aug 2006 | £214,000 |
28, Manning Avenue, Cullompton, Devon EX15 1QE

| Today | See what it's worth now |
| 25 Jul 2024 | £399,000 |
| 20 Jan 2006 | £237,500 |
12, Manning Avenue, Cullompton, Devon EX15 1QE

| Today | See what it's worth now |
| 1 Dec 2023 | £330,000 |
| 16 Jan 2009 | £155,000 |
No other historical records.
9, Manning Avenue, Cullompton, Devon EX15 1QE

| Today | See what it's worth now |
| 18 Sep 2023 | £406,000 |
| 4 Dec 2020 | £355,000 |
25, Manning Avenue, Cullompton, Devon EX15 1QE

| Today | See what it's worth now |
| 17 Oct 2022 | £450,000 |
| 16 Aug 2019 | £252,000 |
21, Manning Avenue, Cullompton, Devon EX15 1QE
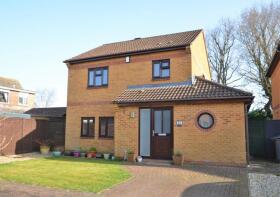
| Today | See what it's worth now |
| 23 Aug 2022 | £380,000 |
| 6 Dec 2006 | £221,000 |
1, Manning Avenue, Cullompton, Devon EX15 1QE
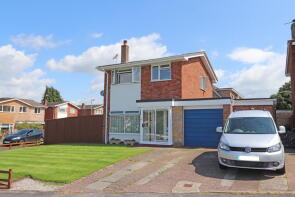
| Today | See what it's worth now |
| 28 Jan 2022 | £300,000 |
| 6 Jul 2009 | £166,000 |
13, Manning Avenue, Cullompton, Devon EX15 1QE

| Today | See what it's worth now |
| 5 Nov 2018 | £312,000 |
| 7 Jul 2000 | £129,500 |
No other historical records.
6, Manning Avenue, Cullompton, Devon EX15 1QE
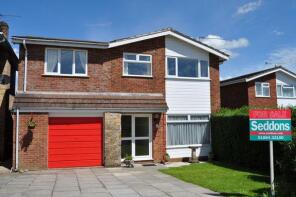
| Today | See what it's worth now |
| 15 Sep 2014 | £250,000 |
No other historical records.
Santa Rosa, Manning Avenue, Cullompton, Devon EX15 1QE

| Today | See what it's worth now |
| 2 Mar 2012 | �£197,000 |
No other historical records.
14, Manning Avenue, Cullompton, Devon EX15 1QE
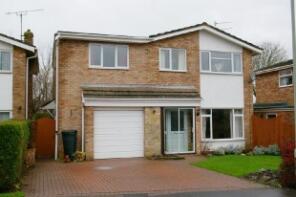
| Today | See what it's worth now |
| 21 Aug 2008 | £227,500 |
No other historical records.
18, Manning Avenue, Cullompton, Devon EX15 1QE

| Today | See what it's worth now |
| 18 Mar 2008 | £275,000 |
| 8 Dec 2000 | £119,275 |
No other historical records.
15, Manning Avenue, Cullompton, Devon EX15 1QE
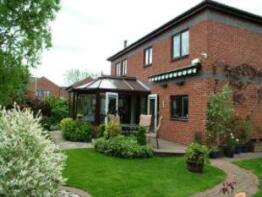
| Today | See what it's worth now |
| 2 Nov 2007 | £320,000 |
| 10 Apr 2000 | £129,950 |
No other historical records.
17, Manning Avenue, Cullompton, Devon EX15 1QE

| Today | See what it's worth now |
| 26 May 2006 | £198,000 |
| 22 Dec 1999 | £98,950 |
No other historical records.
19, Manning Avenue, Cullompton, Devon EX15 1QE

| Today | See what it's worth now |
| 18 Mar 2004 | £189,950 |
| 19 Dec 2003 | £185,000 |
30, Manning Avenue, Cullompton, Devon EX15 1QE

| Today | See what it's worth now |
| 16 Jan 2004 | £178,000 |
| 30 May 2000 | £102,500 |
No other historical records.
22, Manning Avenue, Cullompton, Devon EX15 1QE

| Today | See what it's worth now |
| 7 Feb 2003 | £170,000 |
| 21 Jul 2000 | £105,000 |
No other historical records.
24, Manning Avenue, Cullompton, Devon EX15 1QE

| Today | See what it's worth now |
| 9 May 2002 | £159,950 |
| 27 Oct 2000 | £119,950 |
No other historical records.
38, Manning Avenue, Cullompton, Devon EX15 1QE

| Today | See what it's worth now |
| 2 Oct 2000 | £138,000 |
No other historical records.
34, Manning Avenue, Cullompton, Devon EX15 1QE

| Today | See what it's worth now |
| 29 Aug 2000 | £129,500 |
No other historical records.
26, Manning Avenue, Cullompton, Devon EX15 1QE

| Today | See what it's worth now |
| 11 Aug 2000 | £118,500 |
No other historical records.
20, Manning Avenue, Cullompton, Devon EX15 1QE

| Today | See what it's worth now |
| 4 Aug 2000 | £106,250 |
No other historical records.
7, Manning Avenue, Cullompton, Devon EX15 1QE

| Today | See what it's worth now |
| 28 Jul 2000 | £112,500 |
No other historical records.
32, Manning Avenue, Cullompton, Devon EX15 1QE
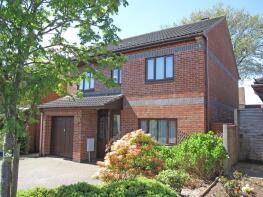
| Today | See what it's worth now |
| 9 Jun 2000 | £117,950 |
No other historical records.
36, Manning Avenue, Cullompton, Devon EX15 1QE

| Today | See what it's worth now |
| 26 May 2000 | £127,000 |
No other historical records.
Find out how much your property is worth
The following agents can provide you with a free, no-obligation valuation. Simply select the ones you'd like to hear from.
Sponsored
All featured agents have paid a fee to promote their valuation expertise.

Nest Associates Ltd
Southwest

Thorne Carter and Aspen
Cullompton

Seddons
Cullompton

Fox & Sons
Tiverton
Get ready with a Mortgage in Principle
- Personalised result in just 20 minutes
- Find out how much you can borrow
- Get viewings faster with agents
- No impact on your credit score
What's your property worth?
House prices near Manning Avenue
Source Acknowledgement: © Crown copyright. England and Wales house price data is publicly available information produced by the HM Land Registry.This material was last updated on 17 April 2025. It covers the period from 1 January 1995 to 28 February 2025 and contains property transactions which have been registered during that period. Contains HM Land Registry data © Crown copyright and database right 2025. This data is licensed under the Open Government Licence v3.0.
Disclaimer: Rightmove.co.uk provides this HM Land Registry data "as is". The burden for fitness of the data relies completely with the user and is provided for informational purposes only. No warranty, express or implied, is given relating to the accuracy of content of the HM Land Registry data and Rightmove does not accept any liability for error or omission. If you have found an error with the data or need further information please contact HM Land Registry.
Permitted Use: Viewers of this Information are granted permission to access this Crown copyright material and to download it onto electronic, magnetic, optical or similar storage media provided that such activities are for private research, study or in-house use only. Any other use of the material requires the formal written permission of Land Registry which can be requested from us, and is subject to an additional licence and associated charge.
Map data ©OpenStreetMap contributors.
Rightmove takes no liability for your use of, or reliance on, Rightmove's Instant Valuation due to the limitations of our tracking tool listed here. Use of this tool is taken entirely at your own risk. All rights reserved.
