
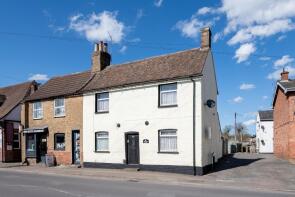
House Prices in Eynesbury
House prices in Eynesbury have an overall average of £303,903 over the last year.
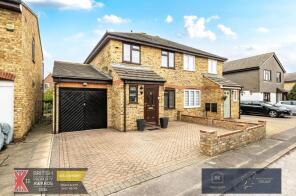
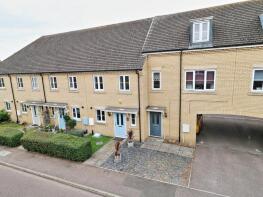
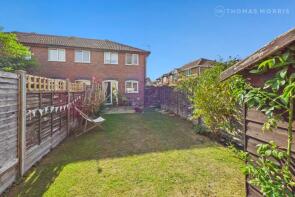
The majority of properties sold in Eynesbury during the last year were terraced properties, selling for an average price of £270,375. Semi-detached properties sold for an average of £308,203, with detached properties fetching £430,456.
Overall, the historical sold prices in Eynesbury over the last year were 7% up on the previous year and 2% down on the 2022 peak of £309,722.
Properties Sold
1, River Terrace, Washbank Road, St. Neots PE19 2TE
| Today | See what it's worth now |
| 9 Apr 2026 | £212,500 |
| 6 Jan 2017 | £204,000 |
2, Malden Way, St. Neots PE19 2GF

| Today | See what it's worth now |
| 27 Mar 2026 | £271,000 |
| 18 Jan 2017 | £212,000 |
27, Chesterfield Way, St. Neots PE19 2JY
| Today | See what it's worth now |
| 26 Mar 2026 | £300,000 |
| 25 Jul 2003 | £134,950 |
No other historical records.
68, Buttercup Avenue, St. Neots PE19 2LE

| Today | See what it's worth now |
| 25 Mar 2026 | £370,000 |
| 16 Nov 2018 | £323,000 |
9, Garden Court, Cemetery Road, St. Neots PE19 2BZ
| Today | See what it's worth now |
| 23 Mar 2026 | £240,000 |
| 22 May 2015 | £265,000 |
No other historical records.
60, Wren Walk, St. Neots PE19 2GE

| Today | See what it's worth now |
| 23 Mar 2026 | £365,000 |
| 29 Jun 2012 | £225,000 |
No other historical records.
39, Flawn Way, St. Neots PE19 2JT
| Today | See what it's worth now |
| 20 Mar 2026 | £355,000 |
| 30 Jun 2005 | £242,995 |
No other historical records.
59, Howitts Lane, St. Neots PE19 2PE
| Today | See what it's worth now |
| 16 Mar 2026 | £270,000 |
| 6 Aug 2019 | £180,000 |
66, Lindisfarne Close, St. Neots PE19 2UU
| Today | See what it's worth now |
| 13 Mar 2026 | £175,000 |
| 30 Jun 2014 | £123,500 |
8, Silver Street, Eynesbury PE19 2TS

| Today | See what it's worth now |
| 13 Mar 2026 | £250,000 |
| 12 Jul 2024 | £150,000 |
No other historical records.
39, Cambridge Street, St. Neots PE19 1JP
| Today | See what it's worth now |
| 9 Mar 2026 | £290,000 |
| 17 Jun 2014 | £181,000 |
11, Blair Way, St. Neots PE19 2SN
| Today | See what it's worth now |
| 5 Mar 2026 | £350,000 |
| 18 Jun 2010 | £191,500 |
7, Cook Drive, St. Neots PE19 2JU
| Today | See what it's worth now |
| 5 Mar 2026 | £264,000 |
| 29 Aug 2019 | £225,000 |
6, Medallion Court, Cambridge Street, St. Neots PE19 1JP
| Today | See what it's worth now |
| 2 Mar 2026 | £175,000 |
| 5 Jan 2023 | £165,000 |
37, Bodiam Way, St. Neots PE19 2RL
| Today | See what it's worth now |
| 27 Feb 2026 | £228,000 |
| 21 Nov 1997 | £45,000 |
No other historical records.
10, Penrwyn Court, Eynesbury PE19 2SU
| Today | See what it's worth now |
| 27 Feb 2026 | £365,000 |
No other historical records.
33, Bevington Way, St. Neots PE19 2HQ

| Today | See what it's worth now |
| 20 Feb 2026 | £416,000 |
| 10 Dec 2004 | £249,107 |
No other historical records.
21, Church Meadows, St. Neots PE19 1PR
| Today | See what it's worth now |
| 20 Feb 2026 | £335,000 |
| 27 Jun 2014 | £215,000 |
179, Duck Lane, St. Neots PE19 2EG
| Today | See what it's worth now |
| 19 Feb 2026 | £260,000 |
| 7 Dec 2022 | £170,000 |
No other historical records.
39, Bishops Road, St. Neots PE19 2QA
| Today | See what it's worth now |
| 18 Feb 2026 | £235,000 |
| 17 Oct 2005 | £140,000 |
7, Silver Street, St. Neots PE19 2TS
| Today | See what it's worth now |
| 17 Feb 2026 | £500,000 |
| 9 Mar 2015 | £218,000 |
No other historical records.
13, Linley Road, St. Neots PE19 2UJ
| Today | See what it's worth now |
| 16 Feb 2026 | £353,000 |
| 13 Jul 2023 | £302,000 |
No other historical records.
55, Sandfields Road, St Neots PE19 1PD
| Today | See what it's worth now |
| 16 Feb 2026 | £255,000 |
No other historical records.
Source Acknowledgement: © Crown copyright. England and Wales house price data is publicly available information produced by the HM Land Registry.This material was last updated on 9 July 2026. It covers the period from 1 January 1995 to 30 April 2026 and contains property transactions which have been registered during that period. Contains HM Land Registry data © Crown copyright and database right 2026. This data is licensed under the Open Government Licence v3.0.
Disclaimer: Rightmove.co.uk provides this HM Land Registry data "as is". The burden for fitness of the data relies completely with the user and is provided for informational purposes only. No warranty, express or implied, is given relating to the accuracy of content of the HM Land Registry data and Rightmove does not accept any liability for error or omission. If you have found an error with the data or need further information please contact HM Land Registry.
Permitted Use: Viewers of this Information are granted permission to access this Crown copyright material and to download it onto electronic, magnetic, optical or similar storage media provided that such activities are for private research, study or in-house use only. Any other use of the material requires the formal written permission of Land Registry which can be requested from us, and is subject to an additional licence and associated charge.
Rightmove takes no liability for your use of, or reliance on, Rightmove's Instant Valuation due to the limitations of our tracking tool listed here. Use of this tool is taken entirely at your own risk. All rights reserved.