
House Prices in Flexbury
House prices in Flexbury have an overall average of £365,905 over the last year.
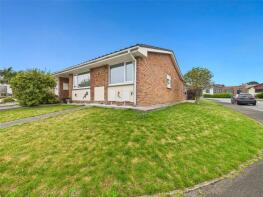
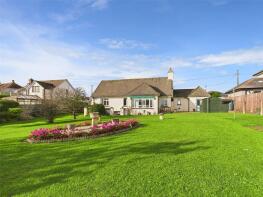
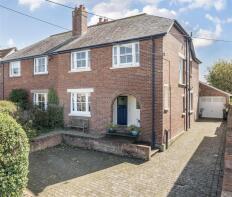
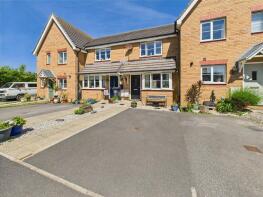
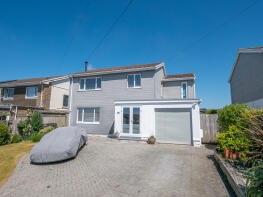
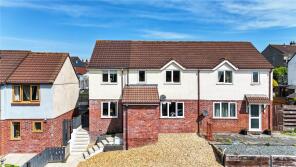
The majority of properties sold in Flexbury during the last year were detached properties, selling for an average price of £448,304. Semi-detached properties sold for an average of £339,239, with terraced properties fetching £305,708.
Overall, the historical sold prices in Flexbury over the last year were 1% down on the previous year and 3% down on the 2022 peak of £376,282.
Properties Sold
9, Cherrill Gardens, Flexbury, Bude EX23 8SL
| Today | See what it's worth now |
| 2 Apr 2026 | £300,000 |
| 25 Jul 2017 | £190,000 |
No other historical records.
Sandford, Poughill Road, Poughill, Bude EX23 8NZ
| Today | See what it's worth now |
| 2 Apr 2026 | £465,000 |
| 4 Feb 2016 | £300,000 |
5, Gurney Close, Flexbury, Bude EX23 8SH

| Today | See what it's worth now |
| 2 Apr 2026 | £350,000 |
No other historical records.
9, The Crescent, Bencoolen Road, Bude EX23 8LE
| Today | See what it's worth now |
| 1 Apr 2026 | £355,000 |
| 29 Jan 2010 | £222,500 |
30 Hollingdale House, Killerton Road, Bude EX23 8EN
| Today | See what it's worth now |
| 1 Apr 2026 | £597,500 |
| 23 Sep 2016 | £435,000 |
5, Hawkers Court, Bude EX23 8SX
| Today | See what it's worth now |
| 17 Mar 2026 | £357,500 |
| 4 Oct 2013 | £263,000 |
12, Lea Way, Poughill, Bude EX23 8HA
| Today | See what it's worth now |
| 17 Mar 2026 | £610,000 |
| 26 May 2021 | £565,000 |
No other historical records.
Ground Floor Flat, 9, Downs View, Flexbury, Bude EX23 8RF
| Today | See what it's worth now |
| 17 Mar 2026 | £270,000 |
| 11 Mar 2026 | £315,000 |
20, Fosters Way, Poughill, Bude EX23 8HF
| Today | See what it's worth now |
| 11 Mar 2026 | £335,000 |
| 19 Jul 2021 | £290,000 |
No other historical records.
59, Kings Hill, Bude EX23 8QH
| Today | See what it's worth now |
| 20 Feb 2026 | £250,000 |
No other historical records.
6, Kittiwake Court, Stratton, Bude EX23 8BG
| Today | See what it's worth now |
| 18 Feb 2026 | £225,000 |
| 31 Dec 2013 | £169,995 |
No other historical records.
11, Hopton Close, Bude EX23 8FG

| Today | See what it's worth now |
| 11 Feb 2026 | £272,500 |
| 28 Aug 2015 | £172,000 |
8, Elm Drive, Bude EX23 8EZ
| Today | See what it's worth now |
| 11 Feb 2026 | £520,000 |
| 17 Jun 2016 | £320,000 |
No other historical records.
43, Agnes Close, Bude EX23 8SB
| Today | See what it's worth now |
| 30 Jan 2026 | £275,000 |
| 14 Jul 2017 | £170,000 |
Flat 3, Kiming, Stratton Road, Bude EX23 8AW
| Today | See what it's worth now |
| 23 Jan 2026 | £90,000 |
| 19 Jul 2016 | £106,000 |
33, Cherrill Gardens, Flexbury, Bude EX23 8SL
| Today | See what it's worth now |
| 20 Jan 2026 | £281,000 |
| 23 Nov 2007 | £218,000 |
No other historical records.
6, Durston Road, Flexbury, Bude EX23 8SJ
| Today | See what it's worth now |
| 20 Jan 2026 | £416,000 |
No other historical records.
8, The Crescent, Bencoolen Road, Bude EX23 8LE
| Today | See what it's worth now |
| 13 Jan 2026 | £323,000 |
No other historical records.
33, Hollabury Road, Poughill, Bude EX23 8JA
| Today | See what it's worth now |
| 19 Dec 2025 | £310,000 |
| 26 Oct 2020 | £275,000 |
9, Southfield Road, Bude EX23 8DN
| Today | See what it's worth now |
| 17 Dec 2025 | £290,000 |
| 18 Oct 2019 | £265,000 |
4, Durston Road, Flexbury, Bude EX23 8SJ
| Today | See what it's worth now |
| 16 Dec 2025 | £420,000 |
| 2 May 2001 | £137,500 |
No other historical records.
5, Southfield Road, Bude EX23 8DN
| Today | See what it's worth now |
| 16 Dec 2025 | £267,500 |
| 27 Oct 2017 | £250,000 |
5, Creathorne Road, Flexbury, Bude EX23 8NT
| Today | See what it's worth now |
| 12 Dec 2025 | £415,000 |
| 11 Nov 2016 | £210,000 |
Source Acknowledgement: © Crown copyright. England and Wales house price data is publicly available information produced by the HM Land Registry.This material was last updated on 9 July 2026. It covers the period from 1 January 1995 to 30 April 2026 and contains property transactions which have been registered during that period. Contains HM Land Registry data © Crown copyright and database right 2026. This data is licensed under the Open Government Licence v3.0.
Disclaimer: Rightmove.co.uk provides this HM Land Registry data "as is". The burden for fitness of the data relies completely with the user and is provided for informational purposes only. No warranty, express or implied, is given relating to the accuracy of content of the HM Land Registry data and Rightmove does not accept any liability for error or omission. If you have found an error with the data or need further information please contact HM Land Registry.
Permitted Use: Viewers of this Information are granted permission to access this Crown copyright material and to download it onto electronic, magnetic, optical or similar storage media provided that such activities are for private research, study or in-house use only. Any other use of the material requires the formal written permission of Land Registry which can be requested from us, and is subject to an additional licence and associated charge.
Rightmove takes no liability for your use of, or reliance on, Rightmove's Instant Valuation due to the limitations of our tracking tool listed here. Use of this tool is taken entirely at your own risk. All rights reserved.