
House Prices in Foulness
House prices in Foulness have an overall average of £441,468 over the last year.
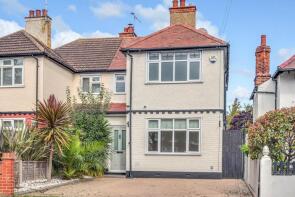
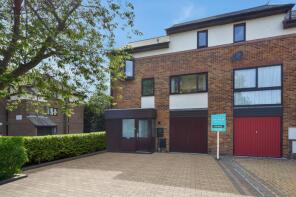
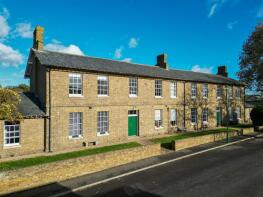
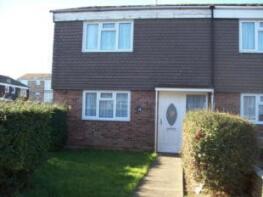
The majority of properties sold in Foulness during the last year were detached properties, selling for an average price of £679,657. Semi-detached properties sold for an average of £402,318, with terraced properties fetching £334,291.
Overall, the historical sold prices in Foulness over the last year were 2% up on the previous year and 3% up on the 2022 peak of £429,432.
Properties Sold
4, Wallace Street, Shoeburyness, Southend-on-sea SS3 9BQ
| Today | See what it's worth now |
| 25 Mar 2026 | £310,000 |
| 21 Dec 2016 | £232,000 |
Flat 7, 31 Nevyll Court, Station Road, Southend-on-sea SS1 3UE
| Today | See what it's worth now |
| 23 Mar 2026 | £150,000 |
| 20 May 2015 | £145,000 |
14, Ness Road, Shoeburyness, Southend-on-sea SS3 9DF
| Today | See what it's worth now |
| 13 Mar 2026 | £307,500 |
| 10 Dec 2004 | £137,500 |
No other historical records.
20, Sandpiper Close, Shoeburyness, Southend-on-sea SS3 9YW
| Today | See what it's worth now |
| 10 Mar 2026 | £342,000 |
| 1 Mar 2011 | £185,000 |
No other historical records.
40, Conway Avenue, Southend-on-sea SS3 0BG

| Today | See what it's worth now |
| 4 Mar 2026 | £375,000 |
| 30 Apr 1999 | £76,000 |
No other historical records.
103, Tudor Gardens, Shoeburyness, Southend-on-sea SS3 9JQ
| Today | See what it's worth now |
| 2 Mar 2026 | £270,000 |
| 12 Oct 2018 | £212,500 |
24, Goldsworthy Drive, Southend-on-sea SS3 0AU
| Today | See what it's worth now |
| 27 Feb 2026 | £420,000 |
| 25 Oct 2018 | £280,000 |
No other historical records.
12, Havengore Close, Southend-on-sea SS3 0PH
| Today | See what it's worth now |
| 27 Feb 2026 | £550,000 |
| 2 Nov 2007 | £330,000 |
No other historical records.
18, Beech Lodge, Southend-on-sea SS3 9FA
| Today | See what it's worth now |
| 27 Feb 2026 | £157,500 |
| 31 Aug 2021 | £145,000 |
72, Dungannon Chase, Southend-on-sea SS1 3NJ
| Today | See what it's worth now |
| 27 Feb 2026 | £252,500 |
| 9 Nov 2012 | £184,000 |
4, Landwick Cottages, New Road, Southend-on-sea SS3 0DH
| Today | See what it's worth now |
| 27 Feb 2026 | £320,000 |
| 22 Feb 2016 | £215,000 |
23, Shillingstone, Shoeburyness, Southend-on-sea SS3 8BY
| Today | See what it's worth now |
| 25 Feb 2026 | £325,000 |
| 29 Jan 2021 | £270,000 |
65, Bishopsteignton, Southend-on-sea SS3 8AF
| Today | See what it's worth now |
| 25 Feb 2026 | £600,000 |
| 10 Jul 1998 | £150,000 |
No other historical records.
55, Church Road, Southend-on-sea SS3 9EU
| Today | See what it's worth now |
| 25 Feb 2026 | £465,000 |
| 19 Mar 2021 | £380,000 |
No other historical records.
7, Rosewood Lane, Shoeburyness, Southend-on-sea SS3 9EW
| Today | See what it's worth now |
| 20 Feb 2026 | £370,000 |
| 21 Mar 2017 | £250,000 |
3, Horseshoe Crescent, Southend-on-sea SS3 9WL
| Today | See what it's worth now |
| 20 Feb 2026 | £350,000 |
| 5 Apr 2022 | £300,000 |
48, Anson Chase, Southend-on-sea SS3 9RG
| Today | See what it's worth now |
| 16 Feb 2026 | £280,000 |
| 20 Jun 2008 | £133,000 |
22a, Seaview Road, Shoeburyness, Southend-on-sea SS3 9DX
| Today | See what it's worth now |
| 16 Feb 2026 | £300,000 |
| 26 Oct 2020 | £240,000 |
57a, Station Road, Southend-on-sea SS1 3JZ
| Today | See what it's worth now |
| 12 Feb 2026 | £507,000 |
| 18 Aug 2010 | £280,000 |
117, Aylesbeare, Shoeburyness SS3 8AG
| Today | See what it's worth now |
| 12 Feb 2026 | £422,500 |
No other historical records.
6, Churchfields, Southend-on-sea SS3 8TT
| Today | See what it's worth now |
| 12 Feb 2026 | £300,000 |
| 30 Nov 2018 | £270,000 |
27, West Road, Shoeburyness, Southend-on-sea SS3 9DR
| Today | See what it's worth now |
| 9 Feb 2026 | £215,000 |
| 24 Mar 2023 | £215,000 |
63, Wakering Road, Shoeburyness, Southend-on-sea SS3 9SZ
| Today | See what it's worth now |
| 6 Feb 2026 | £550,000 |
| 27 Aug 2021 | £465,000 |
8, Leitrim Avenue, Shoeburyness, Southend-on-sea SS3 9HD
| Today | See what it's worth now |
| 6 Feb 2026 | £2,900,000 |
| 18 Dec 2018 | £1,800,000 |
34, Retort Close, Southend-on-sea SS1 2AQ
| Today | See what it's worth now |
| 3 Feb 2026 | £190,000 |
| 29 Apr 2016 | £165,500 |
Source Acknowledgement: © Crown copyright. England and Wales house price data is publicly available information produced by the HM Land Registry.This material was last updated on 15 May 2026. It covers the period from 1 January 1995 to 31 March 2026 and contains property transactions which have been registered during that period. Contains HM Land Registry data © Crown copyright and database right 2026. This data is licensed under the Open Government Licence v3.0.
Disclaimer: Rightmove.co.uk provides this HM Land Registry data "as is". The burden for fitness of the data relies completely with the user and is provided for informational purposes only. No warranty, express or implied, is given relating to the accuracy of content of the HM Land Registry data and Rightmove does not accept any liability for error or omission. If you have found an error with the data or need further information please contact HM Land Registry.
Permitted Use: Viewers of this Information are granted permission to access this Crown copyright material and to download it onto electronic, magnetic, optical or similar storage media provided that such activities are for private research, study or in-house use only. Any other use of the material requires the formal written permission of Land Registry which can be requested from us, and is subject to an additional licence and associated charge.
Map data ©OpenStreetMap contributors.
Rightmove takes no liability for your use of, or reliance on, Rightmove's Instant Valuation due to the limitations of our tracking tool listed here. Use of this tool is taken entirely at your own risk. All rights reserved.