
House Prices in Fulwith
House prices in Fulwith have an overall average of £583,705 over the last year.
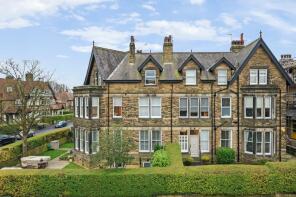
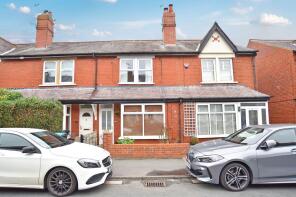
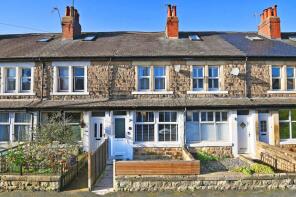
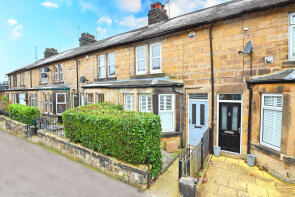
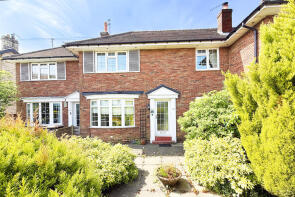
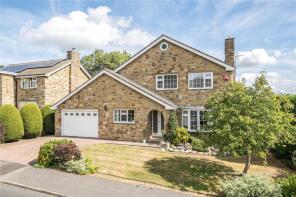
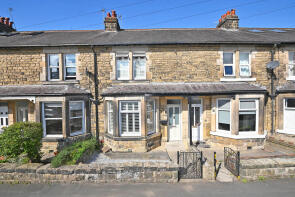
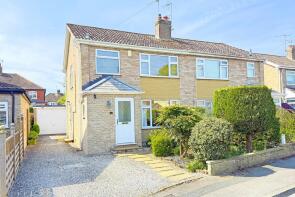
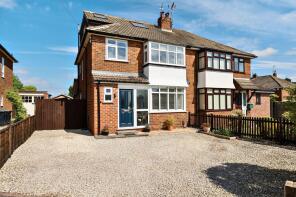
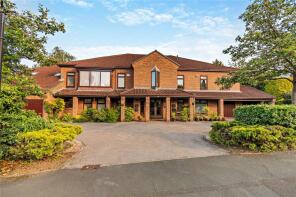
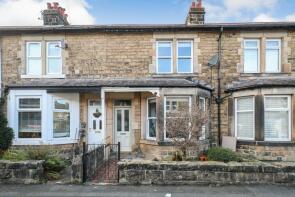
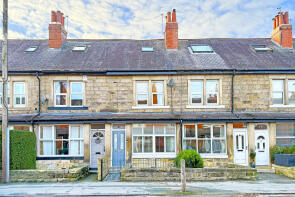
The majority of properties sold in Fulwith during the last year were detached properties, selling for an average price of £859,633. Semi-detached properties sold for an average of £590,600, with terraced properties fetching £354,816.
Overall, the historical sold prices in Fulwith over the last year were 3% up on the previous year and 2% up on the 2022 peak of £573,536.
Properties Sold
Flat 3, 24, South Drive, Harrogate HG2 8AU
| Today | See what it's worth now |
| 20 Mar 2026 | £487,500 |
| 16 May 2014 | £387,500 |
No other historical records.
43, Hookstone Avenue, Harrogate HG2 8ER
| Today | See what it's worth now |
| 20 Mar 2026 | £234,000 |
| 10 Nov 2014 | £187,000 |
11, St Catherines Road, Harrogate HG2 8JZ

| Today | See what it's worth now |
| 19 Mar 2026 | £680,000 |
| 28 Jul 2003 | £285,000 |
No other historical records.
17, Wheatlands Road, Harrogate HG2 8BB

| Today | See what it's worth now |
| 17 Mar 2026 | £1,300,000 |
| 22 Jan 2009 | £767,500 |
No other historical records.
32, Hookstone Avenue, Harrogate HG2 8ER
| Today | See what it's worth now |
| 6 Mar 2026 | £280,000 |
| 29 Oct 2020 | £180,000 |
14, Coronation Avenue, Harrogate HG2 8BY
| Today | See what it's worth now |
| 2 Mar 2026 | £327,000 |
| 27 Apr 2006 | £201,250 |
25 Valmontry, St Winifreds Road, Harrogate HG2 8LW
| Today | See what it's worth now |
| 4 Feb 2026 | £738,000 |
| 24 Aug 2005 | £330,000 |
No other historical records.
7, Fulwith Mill Lane, Harrogate HG2 8HJ
| Today | See what it's worth now |
| 26 Jan 2026 | £1,950,000 |
| 28 Nov 2003 | £730,000 |
7, Almsford Oval, Harrogate HG2 8EJ
| Today | See what it's worth now |
| 23 Jan 2026 | £350,000 |
| 17 Mar 2023 | £275,000 |
140c The Cottage, Hookstone Drive, Harrogate HG2 8PF
| Today | See what it's worth now |
| 23 Jan 2026 | £320,000 |
| 1 Jun 2001 | £125,000 |
No other historical records.
Delamere, Halstead Road, Harrogate HG2 8BP
| Today | See what it's worth now |
| 20 Jan 2026 | £255,000 |
No other historical records.
68d, Leeds Road, Harrogate HG2 8BG
| Today | See what it's worth now |
| 16 Jan 2026 | £295,000 |
| 21 May 2003 | £165,000 |
No other historical records.
9, Fulwith Avenue, Harrogate HG2 8HR
| Today | See what it's worth now |
| 14 Jan 2026 | £950,000 |
| 28 Jul 2016 | £780,000 |
26, Coronation Grove, Harrogate HG2 8BU
| Today | See what it's worth now |
| 12 Jan 2026 | £369,950 |
| 16 Aug 2022 | £347,000 |
14, Wayside Grove, Harrogate HG2 8NR
| Today | See what it's worth now |
| 9 Jan 2026 | £351,000 |
| 12 Apr 2007 | £247,000 |
59, Almsford Drive, Harrogate HG2 8ED
| Today | See what it's worth now |
| 6 Jan 2026 | £540,000 |
| 30 Jun 2006 | £246,000 |
Flat 4, 29a St James Court, Wheatlands Road East, Harrogate HG2 8QS
| Today | See what it's worth now |
| 5 Jan 2026 | £470,000 |
| 4 Mar 2009 | £420,000 |
No other historical records.
Flat 4, 18 Langcliffe Place, Langcliffe Avenue, Harrogate HG2 8JQ

| Today | See what it's worth now |
| 18 Dec 2025 | £278,000 |
| 8 Oct 2018 | £259,995 |
28, Coronation Grove, Harrogate HG2 8BU
| Today | See what it's worth now |
| 17 Dec 2025 | £95,000 |
| 12 Apr 2024 | £327,500 |
16, Hookstone Avenue, Harrogate HG2 8ER
| Today | See what it's worth now |
| 17 Dec 2025 | £250,000 |
| 25 Jun 2021 | £255,000 |
1, Beech Road, Harrogate HG2 8DZ
| Today | See what it's worth now |
| 17 Dec 2025 | £520,000 |
| 31 Mar 2017 | £322,500 |
27, St Catherines Road, Harrogate HG2 8JZ

| Today | See what it's worth now |
| 16 Dec 2025 | £750,000 |
| 7 May 2004 | £285,000 |
No other historical records.
20, Hookstone Avenue, Harrogate HG2 8ER
| Today | See what it's worth now |
| 11 Dec 2025 | £295,000 |
| 26 Aug 2021 | £263,500 |
6, St Helens Road, Harrogate HG2 8LB
| Today | See what it's worth now |
| 9 Dec 2025 | £520,000 |
| 14 Sep 2011 | £300,000 |
No other historical records.
57, Almsford Oval, Harrogate HG2 8EJ
| Today | See what it's worth now |
| 8 Dec 2025 | £633,000 |
| 17 Jul 2017 | £323,000 |
No other historical records.
Source Acknowledgement: © Crown copyright. England and Wales house price data is publicly available information produced by the HM Land Registry.This material was last updated on 15 May 2026. It covers the period from 1 January 1995 to 31 March 2026 and contains property transactions which have been registered during that period. Contains HM Land Registry data © Crown copyright and database right 2026. This data is licensed under the Open Government Licence v3.0.
Disclaimer: Rightmove.co.uk provides this HM Land Registry data "as is". The burden for fitness of the data relies completely with the user and is provided for informational purposes only. No warranty, express or implied, is given relating to the accuracy of content of the HM Land Registry data and Rightmove does not accept any liability for error or omission. If you have found an error with the data or need further information please contact HM Land Registry.
Permitted Use: Viewers of this Information are granted permission to access this Crown copyright material and to download it onto electronic, magnetic, optical or similar storage media provided that such activities are for private research, study or in-house use only. Any other use of the material requires the formal written permission of Land Registry which can be requested from us, and is subject to an additional licence and associated charge.
Map data ©OpenStreetMap contributors.
Rightmove takes no liability for your use of, or reliance on, Rightmove's Instant Valuation due to the limitations of our tracking tool listed here. Use of this tool is taken entirely at your own risk. All rights reserved.