
House Prices in G43
House prices in G43 have an overall average of £264,526 over the last year.
The majority of properties sold in G43 during the last year were flats, selling for an average price of £180,868. Terraced properties sold for an average of £329,978, with semi-detached properties fetching £425,131.
Overall, the historical sold prices in G43 over the last year were 1% down on the previous year and 1% up on the 2023 peak of £261,472.
Properties Sold
42, Lochlea Road, Glasgow G43 2YB

| Today | See what it's worth now |
| 24 Dec 2025 | £375,000 |
| 16 Sep 2020 | £314,000 |
9, Auldfield Gate, Glasgow G43 1FL
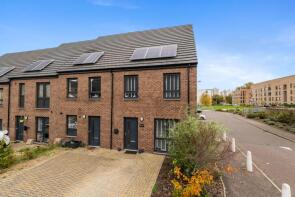
| Today | See what it's worth now |
| 23 Dec 2025 | £373,222 |
| 1 Dec 2021 | £255,000 |
No other historical records.
Flat 1/2, 26, Nethercairn Road, Glasgow G43 2AA
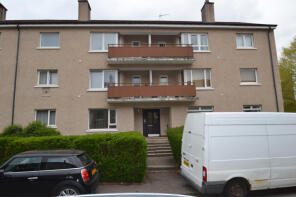
| Today | See what it's worth now |
| 22 Dec 2025 | £98,000 |
| 16 Nov 2021 | £80,000 |
26, Langside Drive, Glasgow G43 2QA
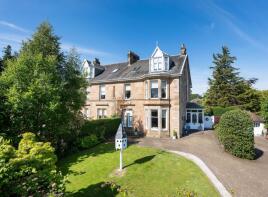
| Today | See what it's worth now |
| 22 Dec 2025 | £900,780 |
No other historical records.
5, Penny Gate, Glasgow G43 1DX

| Today | See what it's worth now |
| 22 Dec 2025 | £267,000 |
| 17 Jun 2019 | £209,995 |
No other historical records.
10, Investment Drive, Glasgow G43 1AQ

| Today | See what it's worth now |
| 18 Dec 2025 | £197,000 |
| 2 Nov 2018 | £156,995 |
No other historical records.
7, Ashmore Road, Glasgow G43 2PN
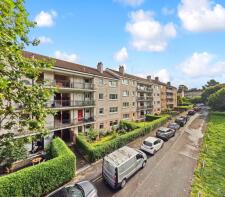
| Today | See what it's worth now |
| 17 Dec 2025 | £150,500 |
| 14 Dec 2021 | £115,257 |
349, Kilmarnock Road, Glasgow G43 2DS
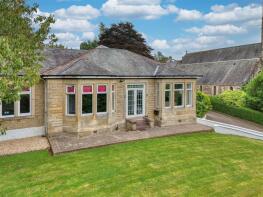
| Today | See what it's worth now |
| 17 Dec 2025 | £737,000 |
| 26 Jun 2015 | £465,557 |
Flat 2/2, 90, Thornliebank Road, Glasgow G43 1DP
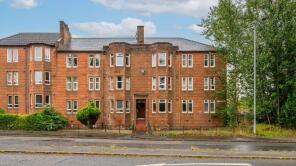
| Today | See what it's worth now |
| 15 Dec 2025 | £171,000 |
| 24 Jul 2020 | £134,747 |
90, Fernleigh Road, Glasgow G43 2TZ
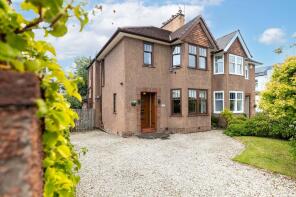
| Today | See what it's worth now |
| 15 Dec 2025 | £561,231 |
| 10 Feb 2020 | £390,000 |
17, Burnfield Drive, Glasgow G43 1BW

| Today | See what it's worth now |
| 15 Dec 2025 | £184,300 |
No other historical records.
5, Bemersyde Avenue, Glasgow G43 1EN

| Today | See what it's worth now |
| 12 Dec 2025 | £305,000 |
No other historical records.
52, Auldburn Road, Glasgow G43 1JX

| Today | See what it's worth now |
| 10 Dec 2025 | £108,000 |
No other historical records.
Flat 3/3, 294, Kilmarnock Road, Glasgow G43 2XS
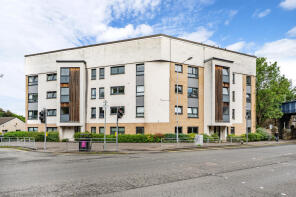
| Today | See what it's worth now |
| 9 Dec 2025 | £205,000 |
| 1 Apr 2022 | £175,000 |
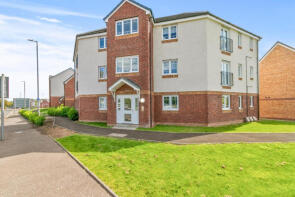
Flat 1/2, 23, Premium Gate, Glasgow G43 1DZ
| Today | See what it's worth now |
| 8 Dec 2025 | £167,000 |
| 5 Apr 2023 | £159,995 |
No other historical records.
127, Nether Auldhouse Road, Glasgow G43 2YS

| Today | See what it's worth now |
| 8 Dec 2025 | £352,000 |
No other historical records.
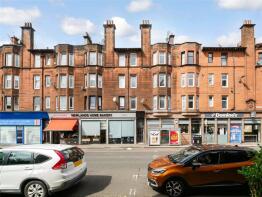
Flat 1/1, 236, Kilmarnock Road, Glasgow G43 1TT
| Today | See what it's worth now |
| 5 Dec 2025 | £165,000 |
No other historical records.
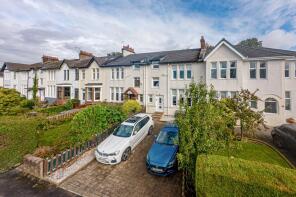
15, Fernleigh Road, Glasgow G43 2UD
| Today | See what it's worth now |
| 5 Dec 2025 | £465,000 |
| 4 Jun 2008 | £268,000 |
No other historical records.
Flat 1/1, 12, Well Green, Glasgow G43 1RR

| Today | See what it's worth now |
| 4 Dec 2025 | £95,000 |
| 6 Dec 2023 | £88,900 |
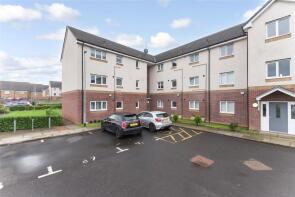
Flat 0/2, 17, Investment Way, Glasgow G43 1AN
| Today | See what it's worth now |
| 2 Dec 2025 | £170,000 |
No other historical records.
4, Alder Place, Glasgow G43 2UX

| Today | See what it's worth now |
| 2 Dec 2025 | £75,000 |
No other historical records.
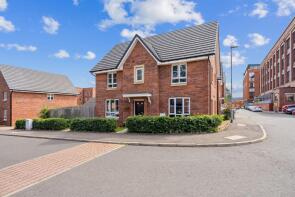
2, Inverlair Drive, Glasgow G43 2AY
| Today | See what it's worth now |
| 1 Dec 2025 | £474,000 |
| 1 Jul 2021 | £320,995 |
No other historical records.
71, Windhill Road, Glasgow G43 2UW

| Today | See what it's worth now |
| 1 Dec 2025 | £100,000 |
| 20 Sep 2011 | £96,000 |
No other historical records.
71, Glasserton Road, Glasgow G43 2LN

| Today | See what it's worth now |
| 28 Nov 2025 | £465,559 |
No other historical records.
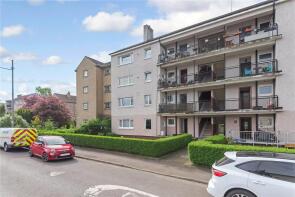
23, Alloway Road, Glasgow G43 2YE
| Today | See what it's worth now |
| 27 Nov 2025 | £142,500 |
No other historical records.
Source Acknowledgement: © Crown copyright. Scottish house price data is publicly available information produced by the Registers of Scotland. Material has been reproduced with the permission of the Keeper of the Registers of Scotland and contains data compiled by Registers of Scotland. For further information, please contact data@ros.gov.uk. Please note the dates shown here relate to the property's registered date not sold date.This material was last updated on 2 December 2025. It covers the period from 8 December 1987 to 31 October 2025 and contains property transactions which have been registered during that period.
Disclaimer: Rightmove.co.uk provides this Registers of Scotland data "as is". The burden for fitness of the data relies completely with the user and is provided for informational purposes only. No warranty, express or implied, is given relating to the accuracy of content of the Registers of Scotland data and Rightmove plc does not accept any liability for error or omission. If you have found an error with the data or need further information please contact data@ros.gov.uk
Permitted Use: The Registers of Scotland allows the reproduction of the data which it provides to Rightmove.co.uk free of charge in any format or medium only for research, private study or for internal circulation within an organisation. This is subject to it being reproduced accurately and not used in a misleading context. The material must be acknowledged as Crown Copyright. You are not allowed to use this information for commercial purposes, nor must you copy, distribute, sell or publish the data in any way. For any other use of this material, please apply to the Registers of Scotland for a licence. You can do this online at www.ros.gov.uk, by email at data@ros.gov.uk or by writing to Business Development, Registers of Scotland, Meadowbank House, 153 London Road, Edinburgh EH8 7AU.
Map data ©OpenStreetMap contributors.
Rightmove takes no liability for your use of, or reliance on, Rightmove's Instant Valuation due to the limitations of our tracking tool listed here. Use of this tool is taken entirely at your own risk. All rights reserved.


