
House Prices in Hathersage Drive, Glasgow, Glasgow City, G69
House prices in Hathersage Drive have an overall average of £172,833 over the last year.
The majority of properties sold in Hathersage Drive during the last year were terraced properties, selling for an average price of £164,250. Semi-detached properties sold for an average of £190,000.
Overall, the historical sold prices in Hathersage Drive over the last year were 20% down on the previous year and 5% up on the 2021 peak of £165,000.
Properties Sold
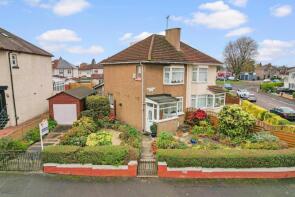
37, Hathersage Drive, Baillieston, Glasgow G69 6QN
| Today | See what it's worth now |
| 8 May 2025 | £190,000 |
No other historical records.
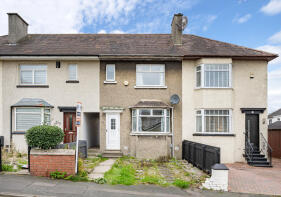
33, Hathersage Drive, Glasgow G69 6QN
| Today | See what it's worth now |
| 3 Apr 2025 | £162,500 |
| 13 Dec 2007 | £112,000 |
No other historical records.
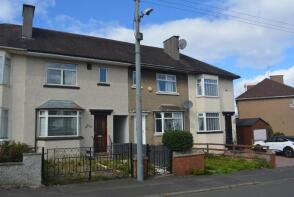
31, Hathersage Drive, Baillieston, Glasgow G69 6QN
| Today | See what it's worth now |
| 26 Nov 2024 | £166,000 |
No other historical records.
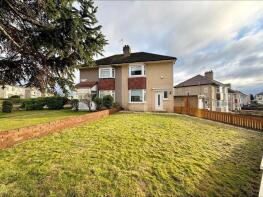
16, Hathersage Drive, Glasgow G69 6QW
| Today | See what it's worth now |
| 13 May 2024 | £215,000 |
| 7 Sep 2016 | £152,500 |
4, Hathersage Drive, Glasgow G69 6QW
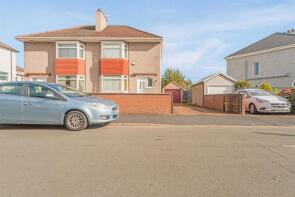
| Today | See what it's worth now |
| 7 Jun 2023 | £210,000 |
No other historical records.
15, Hathersage Drive, Glasgow G69 6QW

| Today | See what it's worth now |
| 1 Nov 2022 | £152,000 |
No other historical records.
5, Hathersage Drive, Glasgow G69 6QW
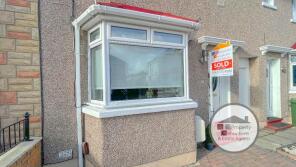
| Today | See what it's worth now |
| 22 Nov 2021 | £165,000 |
No other historical records.
8, Hathersage Drive, Glasgow G69 6QW
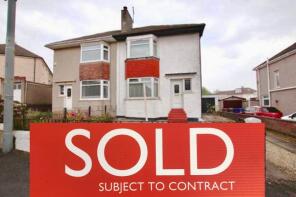
| Today | See what it's worth now |
| 18 Dec 2018 | £173,000 |
No other historical records.
3, Hathersage Drive, Glasgow G69 6QW
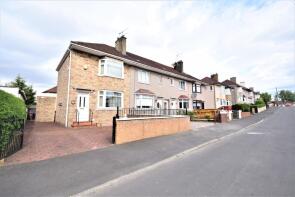
| Today | See what it's worth now |
| 10 Oct 2018 | £132,000 |
No other historical records.
19, Hathersage Drive, Glasgow G69 6QW

| Today | See what it's worth now |
| 26 Jan 2018 | £122,000 |
No other historical records.
7, Hathersage Drive, Glasgow G69 6QW
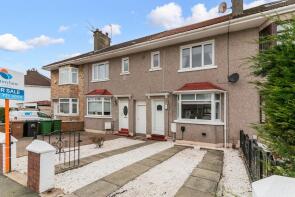
| Today | See what it's worth now |
| 11 Dec 2017 | �£120,000 |
No other historical records.
23, Hathersage Drive, Glasgow G69 6QW
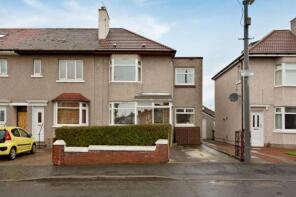
| Today | See what it's worth now |
| 29 Jun 2015 | £130,000 |
No other historical records.
17, Hathersage Drive, Glasgow G69 6QW
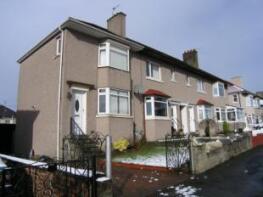
| Today | See what it's worth now |
| 12 Jun 2008 | £124,999 |
No other historical records.
Find out how much your property is worth
The following agents can provide you with a free, no-obligation valuation. Simply select the ones you'd like to hear from.
Sponsored
All featured agents have paid a fee to promote their valuation expertise.

Aberdein Considine
Byres Road

MQ Estate Agents and Lettings
Covering Scotland

Countrywide
Baillieston

McEwan Fraser Legal
Edinburgh

Allen & Harris
Dennistoun Glasgow

YOUR MOVE - McLaughlin
Coatbridge
Get ready with a Mortgage in Principle
- Personalised result in just 20 minutes
- Find out how much you can borrow
- Get viewings faster with agents
- No impact on your credit score
What's your property worth?
House prices near Hathersage Drive
Source Acknowledgement: © Crown copyright. Scottish house price data is publicly available information produced by the Registers of Scotland. Material has been reproduced with the permission of the Keeper of the Registers of Scotland and contains data compiled by Registers of Scotland. For further information, please contact data@ros.gov.uk. Please note the dates shown here relate to the property's registered date not sold date.This material was last updated on 16 July 2025. It covers the period from 28 July 1995 to 30 May 2025 and contains property transactions which have been registered during that period.
Disclaimer: Rightmove.co.uk provides this Registers of Scotland data "as is". The burden for fitness of the data relies completely with the user and is provided for informational purposes only. No warranty, express or implied, is given relating to the accuracy of content of the Registers of Scotland data and Rightmove plc does not accept any liability for error or omission. If you have found an error with the data or need further information please contact data@ros.gov.uk
Permitted Use: The Registers of Scotland allows the reproduction of the data which it provides to Rightmove.co.uk free of charge in any format or medium only for research, private study or for internal circulation within an organisation. This is subject to it being reproduced accurately and not used in a misleading context. The material must be acknowledged as Crown Copyright. You are not allowed to use this information for commercial purposes, nor must you copy, distribute, sell or publish the data in any way. For any other use of this material, please apply to the Registers of Scotland for a licence. You can do this online at www.ros.gov.uk, by email at data@ros.gov.uk or by writing to Business Development, Registers of Scotland, Meadowbank House, 153 London Road, Edinburgh EH8 7AU.
Map data ©OpenStreetMap contributors.
Rightmove takes no liability for your use of, or reliance on, Rightmove's Instant Valuation due to the limitations of our tracking tool listed here. Use of this tool is taken entirely at your own risk. All rights reserved.
