
House Prices in Galmington
House prices in Galmington have an overall average of £298,344 over the last year.
The majority of properties sold in Galmington during the last year were detached properties, selling for an average price of £393,043. Semi-detached properties sold for an average of £294,982, with terraced properties fetching £247,765.
Overall, the historical sold prices in Galmington over the last year were 3% up on the previous year and 4% down on the 2023 peak of £310,350.
Properties Sold
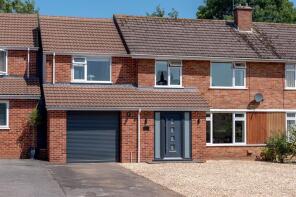
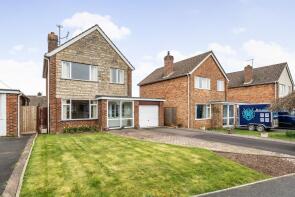
16, Deane Drive, Taunton TA1 5PD
| Today | See what it's worth now |
| 17 Apr 2026 | £285,000 |
| 23 Mar 2026 | £440,750 |
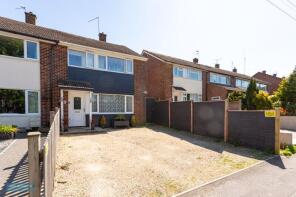
33a, Galmington Road, Taunton TA1 5NL
| Today | See what it's worth now |
| 10 Apr 2026 | £270,000 |
| 19 Oct 2018 | £165,000 |
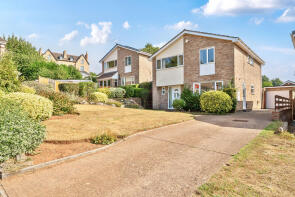
30, Denning Close, Taunton TA1 4NN
| Today | See what it's worth now |
| 7 Apr 2026 | £280,000 |
| 30 Sep 2016 | £195,000 |
23, Princess Road, Taunton TA1 4SY
| Today | See what it's worth now |
| 7 Apr 2026 | £205,000 |
No other historical records.
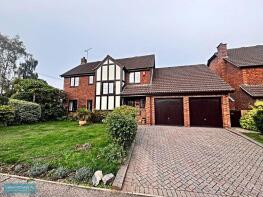
7, Bowfell Close, Taunton TA1 4JP
| Today | See what it's worth now |
| 20 Mar 2026 | £209,000 |
| 9 Dec 1996 | £18,400 |
No other historical records.
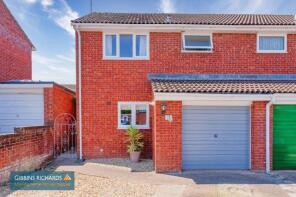
5, Minster Court, Windsor Close, Taunton TA1 4LW
| Today | See what it's worth now |
| 13 Mar 2026 | £158,000 |
| 11 May 2018 | £112,000 |
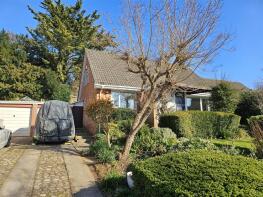
20, Essex Drive, Taunton TA1 4JY
| Today | See what it's worth now |
| 6 Mar 2026 | £425,000 |
| 12 Sep 2014 | £225,000 |
No other historical records.
77, Queensway, Taunton TA1 4NJ
| Today | See what it's worth now |
| 26 Feb 2026 | £279,950 |
| 30 Jun 2011 | £177,500 |
No other historical records.
89, Comeytrowe Lane, Taunton TA1 5QG
| Today | See what it's worth now |
| 20 Feb 2026 | £230,000 |
| 11 Jun 2004 | £139,600 |
16, Glasses Mead, Taunton TA1 5QH
| Today | See what it's worth now |
| 20 Feb 2026 | £360,000 |
| 10 Nov 2000 | £119,950 |
53, Queensway, Taunton TA1 4LD
| Today | See what it's worth now |
| 18 Feb 2026 | £215,000 |
| 2 Sep 2009 | £159,950 |
No other historical records.
18, Essex Drive, Taunton TA1 4JY
| Today | See what it's worth now |
| 13 Feb 2026 | £350,000 |
| 28 Sep 2016 | £234,000 |
No other historical records.
44, Queensway, Taunton TA1 4NJ

| Today | See what it's worth now |
| 6 Feb 2026 | £220,000 |
| 7 Mar 2017 | £158,000 |
81, Comeytrowe Lane, Taunton TA1 5QG
| Today | See what it's worth now |
| 30 Jan 2026 | £195,000 |
| 24 Jan 2025 | £176,000 |
32, Denning Close, Taunton TA1 4NN
| Today | See what it's worth now |
| 19 Jan 2026 | £385,000 |
| 12 Nov 1997 | £86,000 |
No other historical records.
39, Gaunton Close, Taunton TA1 4TW
| Today | See what it's worth now |
| 19 Dec 2025 | £165,000 |
No other historical records.
6, Inner Gullands, Taunton TA1 4SP
| Today | See what it's worth now |
| 17 Dec 2025 | £360,000 |
| 25 May 2001 | £110,000 |
No other historical records.
92, Queensway, Taunton TA1 5QT
| Today | See what it's worth now |
| 17 Dec 2025 | £365,000 |
| 7 Dec 2007 | £249,800 |
No other historical records.
29, Claremont Drive, Taunton TA1 4JG
| Today | See what it's worth now |
| 15 Dec 2025 | £360,000 |
No other historical records.
1, Glasses Mead, Taunton TA1 5QH
| Today | See what it's worth now |
| 12 Dec 2025 | £510,000 |
| 9 Jan 2023 | £450,000 |
15, Bovet Close, Taunton TA1 4NY
| Today | See what it's worth now |
| 12 Dec 2025 | £312,000 |
| 31 Aug 2016 | £181,000 |
3, Angela Close, Taunton TA1 4SB
| Today | See what it's worth now |
| 9 Dec 2025 | £380,000 |
| 12 Nov 2004 | £242,000 |
No other historical records.
7, Pope Close, Taunton TA1 4YE
| Today | See what it's worth now |
| 8 Dec 2025 | £450,000 |
| 22 Apr 1998 | £97,000 |
No other historical records.
Source Acknowledgement: © Crown copyright. England and Wales house price data is publicly available information produced by the HM Land Registry.This material was last updated on 9 July 2026. It covers the period from 1 January 1995 to 30 April 2026 and contains property transactions which have been registered during that period. Contains HM Land Registry data © Crown copyright and database right 2026. This data is licensed under the Open Government Licence v3.0.
Disclaimer: Rightmove.co.uk provides this HM Land Registry data "as is". The burden for fitness of the data relies completely with the user and is provided for informational purposes only. No warranty, express or implied, is given relating to the accuracy of content of the HM Land Registry data and Rightmove does not accept any liability for error or omission. If you have found an error with the data or need further information please contact HM Land Registry.
Permitted Use: Viewers of this Information are granted permission to access this Crown copyright material and to download it onto electronic, magnetic, optical or similar storage media provided that such activities are for private research, study or in-house use only. Any other use of the material requires the formal written permission of Land Registry which can be requested from us, and is subject to an additional licence and associated charge.
Rightmove takes no liability for your use of, or reliance on, Rightmove's Instant Valuation due to the limitations of our tracking tool listed here. Use of this tool is taken entirely at your own risk. All rights reserved.