
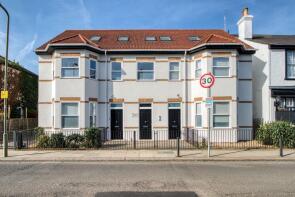
House Prices in Ganwick
House prices in Ganwick have an overall average of £749,000 over the last year.
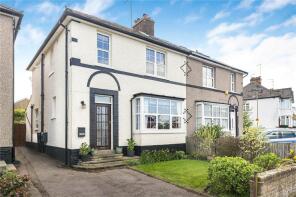
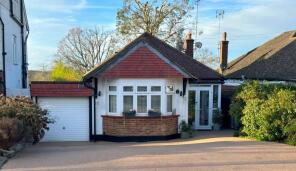
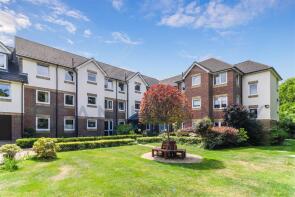
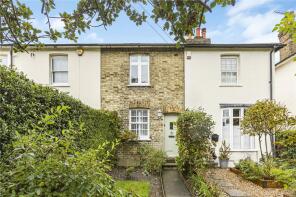
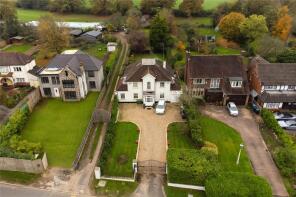
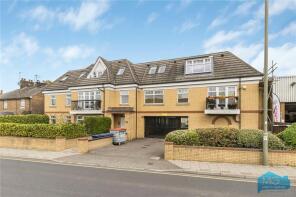
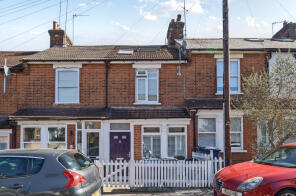
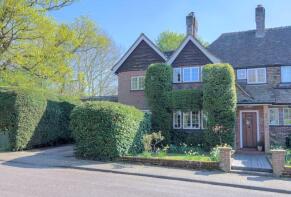
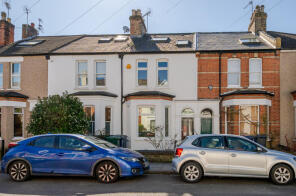
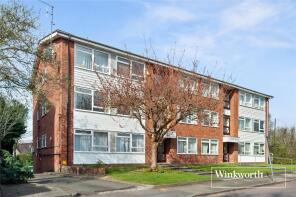
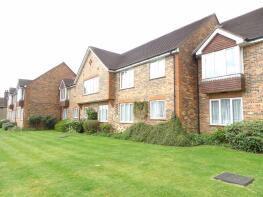
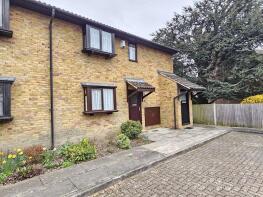
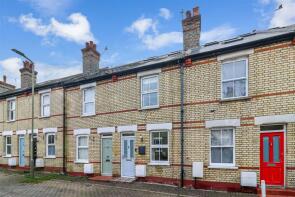
The majority of properties sold in Ganwick during the last year were terraced properties, selling for an average price of £735,115. Flats sold for an average of £321,650, with detached properties fetching £1,024,250.
Overall, the historical sold prices in Ganwick over the last year were 5% up on the previous year and 3% up on the 2021 peak of £728,425.
Properties Sold
3, Cavendish Road, Barnet EN5 4ED
| Today | See what it's worth now |
| 12 Feb 2026 | £850,000 |
No other historical records.
72, Strafford Road, Barnet EN5 4LR
| Today | See what it's worth now |
| 6 Feb 2026 | £580,000 |
No other historical records.
8, The Logans, Blenheim Road, Barnet EN5 4NQ
| Today | See what it's worth now |
| 27 Jan 2026 | £451,000 |
| 25 Mar 2011 | £278,000 |
No other historical records.
8, Queens Road, Barnet EN5 4DG


| Today | See what it's worth now |
| 19 Jan 2026 | £950,000 |
No other historical records.
49, Union Street, Barnet EN5 4HY
| Today | See what it's worth now |
| 19 Jan 2026 | £685,000 |
| 14 Apr 2011 | £345,000 |
No other historical records.
2, Meadowside, Puller Road, Barnet EN5 4HB

| Today | See what it's worth now |
| 16 Jan 2026 | £850,000 |
No other historical records.
53, Wentworth Road, Barnet EN5 4NZ
| Today | See what it's worth now |
| 15 Jan 2026 | £749,000 |
No other historical records.
81, Hadley Highstone, Dury Road To Great North Road, Barnet EN5 4QQ

| Today | See what it's worth now |
| 9 Jan 2026 | £525,000 |
| 30 Nov 1999 | £172,500 |
65, Sebright Road, Barnet EN5 4HP

| Today | See what it's worth now |
| 15 Dec 2025 | £740,000 |
| 8 Jun 2016 | £625,000 |
39, Old Fold View, Grimsdyke Cres To No Sixty Seven, Barnet EN5 4EA
| Today | See what it's worth now |
| 15 Dec 2025 | £850,000 |
| 22 May 2015 | £580,000 |
No other historical records.
Flat 38, 10 Livingstone Court, Christ Church Lane, Barnet EN5 4PL
| Today | See what it's worth now |
| 15 Dec 2025 | £285,000 |
| 19 Dec 2003 | £200,000 |
No other historical records.
89, Hadley Highstone, Dury Road To Great North Road, Barnet EN5 4QQ
| Today | See what it's worth now |
| 14 Nov 2025 | £627,500 |
| 16 Dec 2016 | £575,000 |
Pen Y Cae, Galley Lane, Arkley Barnet Section, Barnet EN5 4AJ
| Today | See what it's worth now |
| 30 Oct 2025 | £1,882,500 |
No other historical records.
Flat 3, 38 Ridgeleigh Court, St Albans Road, Barnet EN5 4LH
| Today | See what it's worth now |
| 15 Oct 2025 | £425,000 |
| 4 Sep 2017 | £450,000 |
90, Puller Road, Barnet EN5 4HD
| Today | See what it's worth now |
| 10 Oct 2025 | £665,000 |
| 26 Mar 2021 | £630,000 |
18, Sunset View, Barnet EN5 4LB
| Today | See what it's worth now |
| 2 Oct 2025 | £1,440,000 |
No other historical records.
Flat 3, 7, Alston Road, Barnet EN5 4ET
| Today | See what it's worth now |
| 1 Oct 2025 | £355,000 |
| 30 Aug 2018 | £370,000 |
No other historical records.
11, Carnarvon Road, Barnet EN5 4LX
| Today | See what it's worth now |
| 22 Sep 2025 | £757,500 |
| 16 Jul 2007 | £419,950 |
9, The Avenue, Barnet EN5 4EN
| Today | See what it's worth now |
| 19 Sep 2025 | £1,515,000 |
| 31 Mar 2011 | £1,030,000 |
No other historical records.
67, Hadley Highstone, Dury Road To Great North Road, Barnet EN5 4QQ
| Today | See what it's worth now |
| 29 Aug 2025 | £955,000 |
No other historical records.
2, Campana Court, Blenheim Road, Barnet EN5 4NG
| Today | See what it's worth now |
| 28 Aug 2025 | £480,000 |
| 9 Oct 2020 | £465,000 |
6, Hertswood Court, Hillside Gardens, Barnet EN5 4AU
| Today | See what it's worth now |
| 27 Aug 2025 | £123,000 |
| 7 Oct 2005 | £160,000 |
61, St Albans Road, Barnet EN5 4LN
| Today | See what it's worth now |
| 18 Aug 2025 | £285,000 |
| 30 Jun 2000 | £95,000 |
No other historical records.
6, Lucan Road, Barnet EN5 4HA
| Today | See what it's worth now |
| 15 Aug 2025 | £640,000 |
| 24 Mar 2017 | £500,000 |
111, St Albans Road, Barnet EN5 4LD
| Today | See what it's worth now |
| 15 Aug 2025 | £728,000 |
| 1 Jun 2005 | £325,000 |
Source Acknowledgement: © Crown copyright. England and Wales house price data is publicly available information produced by the HM Land Registry.This material was last updated on 9 April 2026. It covers the period from 1 January 1995 to 27 February 2026 and contains property transactions which have been registered during that period. Contains HM Land Registry data © Crown copyright and database right 2026. This data is licensed under the Open Government Licence v3.0.
Disclaimer: Rightmove.co.uk provides this HM Land Registry data "as is". The burden for fitness of the data relies completely with the user and is provided for informational purposes only. No warranty, express or implied, is given relating to the accuracy of content of the HM Land Registry data and Rightmove does not accept any liability for error or omission. If you have found an error with the data or need further information please contact HM Land Registry.
Permitted Use: Viewers of this Information are granted permission to access this Crown copyright material and to download it onto electronic, magnetic, optical or similar storage media provided that such activities are for private research, study or in-house use only. Any other use of the material requires the formal written permission of Land Registry which can be requested from us, and is subject to an additional licence and associated charge.
Map data ©OpenStreetMap contributors.
Rightmove takes no liability for your use of, or reliance on, Rightmove's Instant Valuation due to the limitations of our tracking tool listed here. Use of this tool is taken entirely at your own risk. All rights reserved.