
House Prices in Gore Down
House prices in Gore Down have an overall average of £398,730 over the last year.
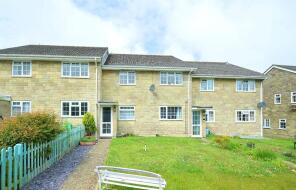
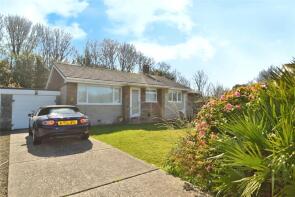
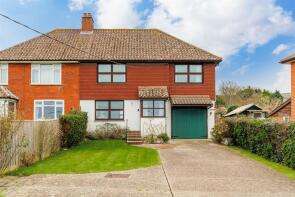
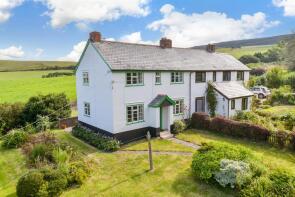
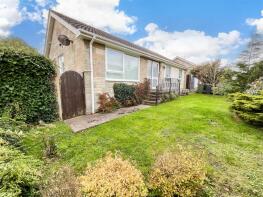
The majority of properties sold in Gore Down during the last year were detached properties, selling for an average price of £463,562. Semi-detached properties sold for an average of £352,083, with flats fetching £159,950.
Overall, the historical sold prices in Gore Down over the last year were 1% up on the previous year and 19% down on the 2022 peak of £493,835.
Properties Sold
Highfield, Ashknowle Lane, Ventnor PO38 2PP


| Today | See what it's worth now |
| 30 Oct 2025 | £600,000 |
| 7 Jan 2021 | £410,000 |
11, Whitwell Farm Maisonettes, High Street, Ventnor PO38 2PY
| Today | See what it's worth now |
| 14 Oct 2025 | £159,950 |
| 16 Oct 2002 | £75,000 |
No other historical records.
Crossbanks, Barrack Shute, Niton PO38 2BE

| Today | See what it's worth now |
| 10 Oct 2025 | £375,000 |
| 5 Mar 2002 | £153,000 |
No other historical records.
24, Greenlydd Close, Ventnor PO38 2BJ
| Today | See what it's worth now |
| 26 Sep 2025 | £300,000 |
| 15 Dec 2014 | £220,000 |
5, Bannock Road, Ventnor PO38 2RD
| Today | See what it's worth now |
| 23 Sep 2025 | £272,500 |
| 28 Jul 1995 | £64,500 |
No other historical records.
13, Verlands Close, Ventnor PO38 2BG
| Today | See what it's worth now |
| 10 Sep 2025 | £320,000 |
| 18 Mar 2020 | £243,400 |
15, Verlands Close, Ventnor PO38 2BG
| Today | See what it's worth now |
| 22 Aug 2025 | £320,000 |
| 4 Jun 2015 | £205,000 |
1, Westview Cottages, Chale Street, Ventnor PO38 2HF
| Today | See what it's worth now |
| 5 Aug 2025 | £335,000 |
| 17 Sep 1998 | £77,000 |
No other historical records.
Chale Abbey Farm Cottage, Upper House Lane, Ventnor PO38 2HD
| Today | See what it's worth now |
| 25 Jul 2025 | £427,500 |
| 29 Aug 2008 | £245,000 |
No other historical records.
78, Bannock Road, Ventnor PO38 2RB
| Today | See what it's worth now |
| 25 Jul 2025 | £285,000 |
| 30 Jun 1998 | £70,000 |
No other historical records.
Fairview, Chale Street, Ventnor PO38 2HG

| Today | See what it's worth now |
| 18 Jul 2025 | £565,000 |
| 26 Mar 2013 | £240,000 |
No other historical records.
Box Cottage, Southdown, Ventnor PO38 2LJ

| Today | See what it's worth now |
| 17 Jul 2025 | £661,000 |
| 1 Apr 2021 | £500,000 |
No other historical records.
45, Greenlydd Close, Ventnor PO38 2BJ
| Today | See what it's worth now |
| 1 Jul 2025 | £335,000 |
| 9 Aug 2023 | £340,000 |
7, Bannock Road, Ventnor PO38 2RD
| Today | See what it's worth now |
| 3 Jun 2025 | £370,000 |
| 24 Mar 2006 | £209,000 |
No other historical records.
Old School House, Newport Road, Ventnor PO38 2QW

| Today | See what it's worth now |
| 2 May 2025 | £655,000 |
| 4 Sep 2015 | £479,950 |
Wendover, Barrack Shute, Niton PO38 2BE
| Today | See what it's worth now |
| 31 Mar 2025 | £345,000 |
No other historical records.
North View, Crocker Lane, Niton PO38 2NX

| Today | See what it's worth now |
| 31 Mar 2025 | £650,000 |
No other historical records.
15, Glen Approach, Ventnor PO38 2BL
| Today | See what it's worth now |
| 27 Mar 2025 | £249,500 |
| 25 Apr 2007 | £180,750 |
No other historical records.
2, Primrose Villas, Kemming Road, Ventnor PO38 2QX
| Today | See what it's worth now |
| 27 Mar 2025 | £280,000 |
| 5 Mar 2020 | £234,000 |
No other historical records.
Corner Ways, Barrack Shute, Niton Undercliff, Niton PO38 2NJ
| Today | See what it's worth now |
| 21 Mar 2025 | £480,000 |
No other historical records.
32, Bannock Road, Ventnor PO38 2RD
| Today | See what it's worth now |
| 21 Mar 2025 | £275,000 |
| 19 Apr 2007 | £225,000 |
13, Nettlecombe Lane, Ventnor PO38 2QA

| Today | See what it's worth now |
| 12 Mar 2025 | £349,950 |
| 7 Jul 2017 | £271,000 |
Kloof, Chale Street, Chale Green, Chale PO38 2JQ

| Today | See what it's worth now |
| 20 Feb 2025 | £285,000 |
No other historical records.
Southford Farm, Godshill Road, Whitwell, Ventnor PO38 2QH

| Today | See what it's worth now |
| 14 Feb 2025 | £670,000 |
No other historical records.
6, Great Appleford Barns, Appleford Lane, Ventnor PO38 2PN

| Today | See what it's worth now |
| 12 Feb 2025 | £540,000 |
| 24 Mar 2020 | £405,000 |
Source Acknowledgement: © Crown copyright. England and Wales house price data is publicly available information produced by the HM Land Registry.This material was last updated on 4 February 2026. It covers the period from 1 January 1995 to 24 December 2025 and contains property transactions which have been registered during that period. Contains HM Land Registry data © Crown copyright and database right 2026. This data is licensed under the Open Government Licence v3.0.
Disclaimer: Rightmove.co.uk provides this HM Land Registry data "as is". The burden for fitness of the data relies completely with the user and is provided for informational purposes only. No warranty, express or implied, is given relating to the accuracy of content of the HM Land Registry data and Rightmove does not accept any liability for error or omission. If you have found an error with the data or need further information please contact HM Land Registry.
Permitted Use: Viewers of this Information are granted permission to access this Crown copyright material and to download it onto electronic, magnetic, optical or similar storage media provided that such activities are for private research, study or in-house use only. Any other use of the material requires the formal written permission of Land Registry which can be requested from us, and is subject to an additional licence and associated charge.
Map data ©OpenStreetMap contributors.
Rightmove takes no liability for your use of, or reliance on, Rightmove's Instant Valuation due to the limitations of our tracking tool listed here. Use of this tool is taken entirely at your own risk. All rights reserved.