
House Prices in Great Nancekuke
House prices in Great Nancekuke have an overall average of £296,520 over the last year.
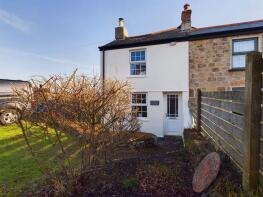
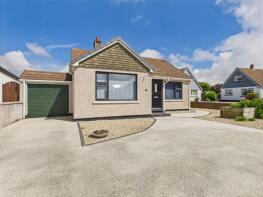
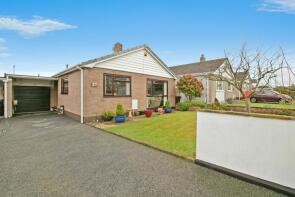
The majority of properties sold in Great Nancekuke during the last year were semi-detached properties, selling for an average price of £268,763. Detached properties sold for an average of £382,993, with terraced properties fetching £250,562.
Overall, the historical sold prices in Great Nancekuke over the last year were 9% down on the previous year and 13% down on the 2023 peak of £341,390.
Properties Sold
20 Little Alexandra, Alexandra Road, Redruth TR16 4DY
| Today | See what it's worth now |
| 19 Dec 2025 | £320,000 |
| 2 Nov 2005 | £207,000 |
No other historical records.
41, Alexandra Close, Redruth TR16 4RS
| Today | See what it's worth now |
| 19 Dec 2025 | £310,000 |
| 19 May 2021 | £250,000 |
No other historical records.
Sunray, Primrose Terrace, Redruth TR16 4JS
| Today | See what it's worth now |
| 18 Dec 2025 | £340,000 |
| 13 Dec 2013 | £140,000 |
No other historical records.
13, Homefield Park, Redruth TR16 4AB
| Today | See what it's worth now |
| 17 Dec 2025 | £225,000 |
| 30 Oct 2012 | £160,000 |
No other historical records.
Carn View Farm, Trevelyan Road, Paynters Lane End, Illogan TR16 4RR
| Today | See what it's worth now |
| 16 Dec 2025 | £390,000 |
| 14 May 2014 | £205,000 |
No other historical records.
59, Sunnyside Parc, Redruth TR15 3LX
| Today | See what it's worth now |
| 5 Dec 2025 | £360,000 |
| 23 Feb 2018 | £310,000 |
No other historical records.
8, Chynance, Redruth TR16 4NL
| Today | See what it's worth now |
| 19 Nov 2025 | £335,000 |
| 12 Oct 2022 | £315,000 |
True North, Green Lane, Redruth TR16 4NX
| Today | See what it's worth now |
| 14 Nov 2025 | £649,400 |
| 6 Dec 1996 | £94,950 |
No other historical records.
50 Melita, Alexandra Road, Redruth TR16 4EA
| Today | See what it's worth now |
| 11 Nov 2025 | £680,000 |
| 25 Feb 2021 | £485,000 |
No other historical records.
8, Warwick Avenue, Redruth TR16 4DZ
| Today | See what it's worth now |
| 7 Nov 2025 | £385,000 |
| 14 Sep 2007 | £249,950 |
No other historical records.
15, Trevelthan Road, Redruth TR16 4DX
| Today | See what it's worth now |
| 7 Nov 2025 | £280,000 |
| 25 Oct 2019 | £225,000 |
No other historical records.
42, Jennings Road, Redruth TR15 1EB
| Today | See what it's worth now |
| 24 Oct 2025 | £267,500 |
| 13 Oct 2023 | £270,000 |
Lichen, Bridge Moor, Redruth TR16 4QA
| Today | See what it's worth now |
| 24 Oct 2025 | £326,000 |
| 31 Oct 1997 | £57,950 |
No other historical records.
7, Forthvean, Redruth TR16 4NY
| Today | See what it's worth now |
| 22 Oct 2025 | £385,000 |
| 11 Aug 2021 | £250,000 |
No other historical records.
7 Dargai House, Alexandra Road, Redruth TR16 4DY
| Today | See what it's worth now |
| 13 Oct 2025 | £450,000 |
| 28 Mar 2002 | £240,000 |
11, Churchtown Road, Redruth TR16 4SF

| Today | See what it's worth now |
| 10 Oct 2025 | £140,000 |
| 28 Mar 2003 | £73,500 |
No other historical records.
8, Robartes Terrace, Redruth TR16 4RX
| Today | See what it's worth now |
| 10 Oct 2025 | £260,000 |
| 4 Feb 2022 | £260,000 |
3, Robartes Terrace, Redruth TR16 4RX
| Today | See what it's worth now |
| 19 Sep 2025 | £298,500 |
| 7 May 2019 | £156,000 |
No other historical records.
Copper Cottage, Bridge Row, Bridge Hill, Bridge TR16 4QW
| Today | See what it's worth now |
| 19 Sep 2025 | £185,000 |
| 19 Dec 2011 | £154,000 |
Carne View Cottage, Ventonraze, Redruth TR16 4RY
| Today | See what it's worth now |
| 5 Sep 2025 | £232,500 |
| 24 Aug 2018 | £165,000 |
27, Park An Lann, Illogan TR16 4FQ
| Today | See what it's worth now |
| 22 Aug 2025 | £120,000 |
No other historical records.
Glowroy Cottage, Bridge Road, Redruth TR16 4SA
| Today | See what it's worth now |
| 15 Aug 2025 | £275,000 |
| 21 Feb 2019 | £188,000 |
35, Treforthlan, Redruth TR16 4RN
| Today | See what it's worth now |
| 8 Aug 2025 | £335,000 |
| 12 Nov 2009 | £230,000 |
No other historical records.
27, Bosvean Gardens, Redruth TR16 4DH
| Today | See what it's worth now |
| 6 Aug 2025 | £343,000 |
| 23 Jul 2010 | £124,000 |
No other historical records.
15, Robartes Terrace, Redruth TR16 4RX

| Today | See what it's worth now |
| 1 Aug 2025 | £315,000 |
| 24 May 2018 | £200,000 |
No other historical records.
Source Acknowledgement: © Crown copyright. England and Wales house price data is publicly available information produced by the HM Land Registry.This material was last updated on 4 February 2026. It covers the period from 1 January 1995 to 24 December 2025 and contains property transactions which have been registered during that period. Contains HM Land Registry data © Crown copyright and database right 2026. This data is licensed under the Open Government Licence v3.0.
Disclaimer: Rightmove.co.uk provides this HM Land Registry data "as is". The burden for fitness of the data relies completely with the user and is provided for informational purposes only. No warranty, express or implied, is given relating to the accuracy of content of the HM Land Registry data and Rightmove does not accept any liability for error or omission. If you have found an error with the data or need further information please contact HM Land Registry.
Permitted Use: Viewers of this Information are granted permission to access this Crown copyright material and to download it onto electronic, magnetic, optical or similar storage media provided that such activities are for private research, study or in-house use only. Any other use of the material requires the formal written permission of Land Registry which can be requested from us, and is subject to an additional licence and associated charge.
Map data ©OpenStreetMap contributors.
Rightmove takes no liability for your use of, or reliance on, Rightmove's Instant Valuation due to the limitations of our tracking tool listed here. Use of this tool is taken entirely at your own risk. All rights reserved.